
What Is Content Monitoring?
Content monitoring involves assessing how well your articles, landing pages, social media posts, and other content performs. And observing your competitors’ performance to gain insights that can improve your efforts.
For instance, if your blog posts consistently show high bounce rates or low engagement, that may mean your content doesn’t align with what your audience wants.
From there, you can adjust.
And if you see that a competitor's content on certain topics gets a lot of traffic, it can indicate a strong online interest in the subject.
That may prompt you to create your own content on those topics to attract more visitors.
Why Is Online Content Monitoring Important?
Content monitoring lets you fine-tune your strategy over time to ensure you meet audience needs and stay ahead in your market.
Here are five specific benefits:
Identify Content Gaps
Content monitoring helps you see what content other market players are creating that you might be missing. Providing you with a blueprint for your content marketing efforts.
Let’s say you use the Keyword Gap tool to uncover terms your competitors are ranking for (meaning appearing in search results) but you aren’t.
(We’ll go over doing this type of analysis in greater detail later in this guide).
These keywords all represent topics you either haven’t covered or haven’t covered well enough to garner rankings.
And you can now act on this information to fill your gaps.
Find Optimization Opportunities
Content monitoring that involves looking into your competitors allows you to benchmark. So you can understand whether you need to improve—and by how much.
Let’s say you use Traffic Analytics to evaluate your metrics against your competitors’ metrics. And notice that your average visit duration is lower than it is for almost all your rivals.
That could be an indication that your content isn’t comprehensive enough or crafted with user intent in mind.
Improving your content to be more thorough and/or more aligned with what users are looking for could result in better engagement metrics and higher search engine results page (SERP) rankings.
Further reading: The Art of Content Optimization: The Complete 2024 Guide
Mitigate the Impact of Algorithm Updates
Google algorithm updates can affect your site's visibility and online rankings. And monitoring your content helps you notice the impact of such changes, so you can adapt to them.
For instance, Google’s 2021 and 2022 page experience updates made the Core Web Vitals (a set of metrics indicating how user-friendly a website is) a search ranking factor. And sites that weren’t prioritizing the user experience likely saw declines that prompted them to make improvements.
If you notice a drop in your Google rankings, consider whether it follows an algorithm update. So you can look into it and determine whether you need to take action.
Which Metrics Should You Monitor?
Here are some important content-related metrics to monitor:
Keyword Rankings
Keyword rankings are the positions your pages occupy in search results. And tracking rankings lets you see which search terms bring traffic to your site—and which don’t.
This information allows you to refine your SEO strategy. By focusing on keywords that can potentially draw more visitors and adjusting content that isn't performing well.
Further reading: Keyword Performance: What It Is and How to Track It
Organic Search Traffic
Organic traffic is the amount of unpaid traffic you get from search engines. And is a direct indicator of how successful your SEO efforts are, letting you understand if your content is effectively drawing in users.
It’s also a great metric for comparing yourself against rivals.
Organic Click-Through Rate
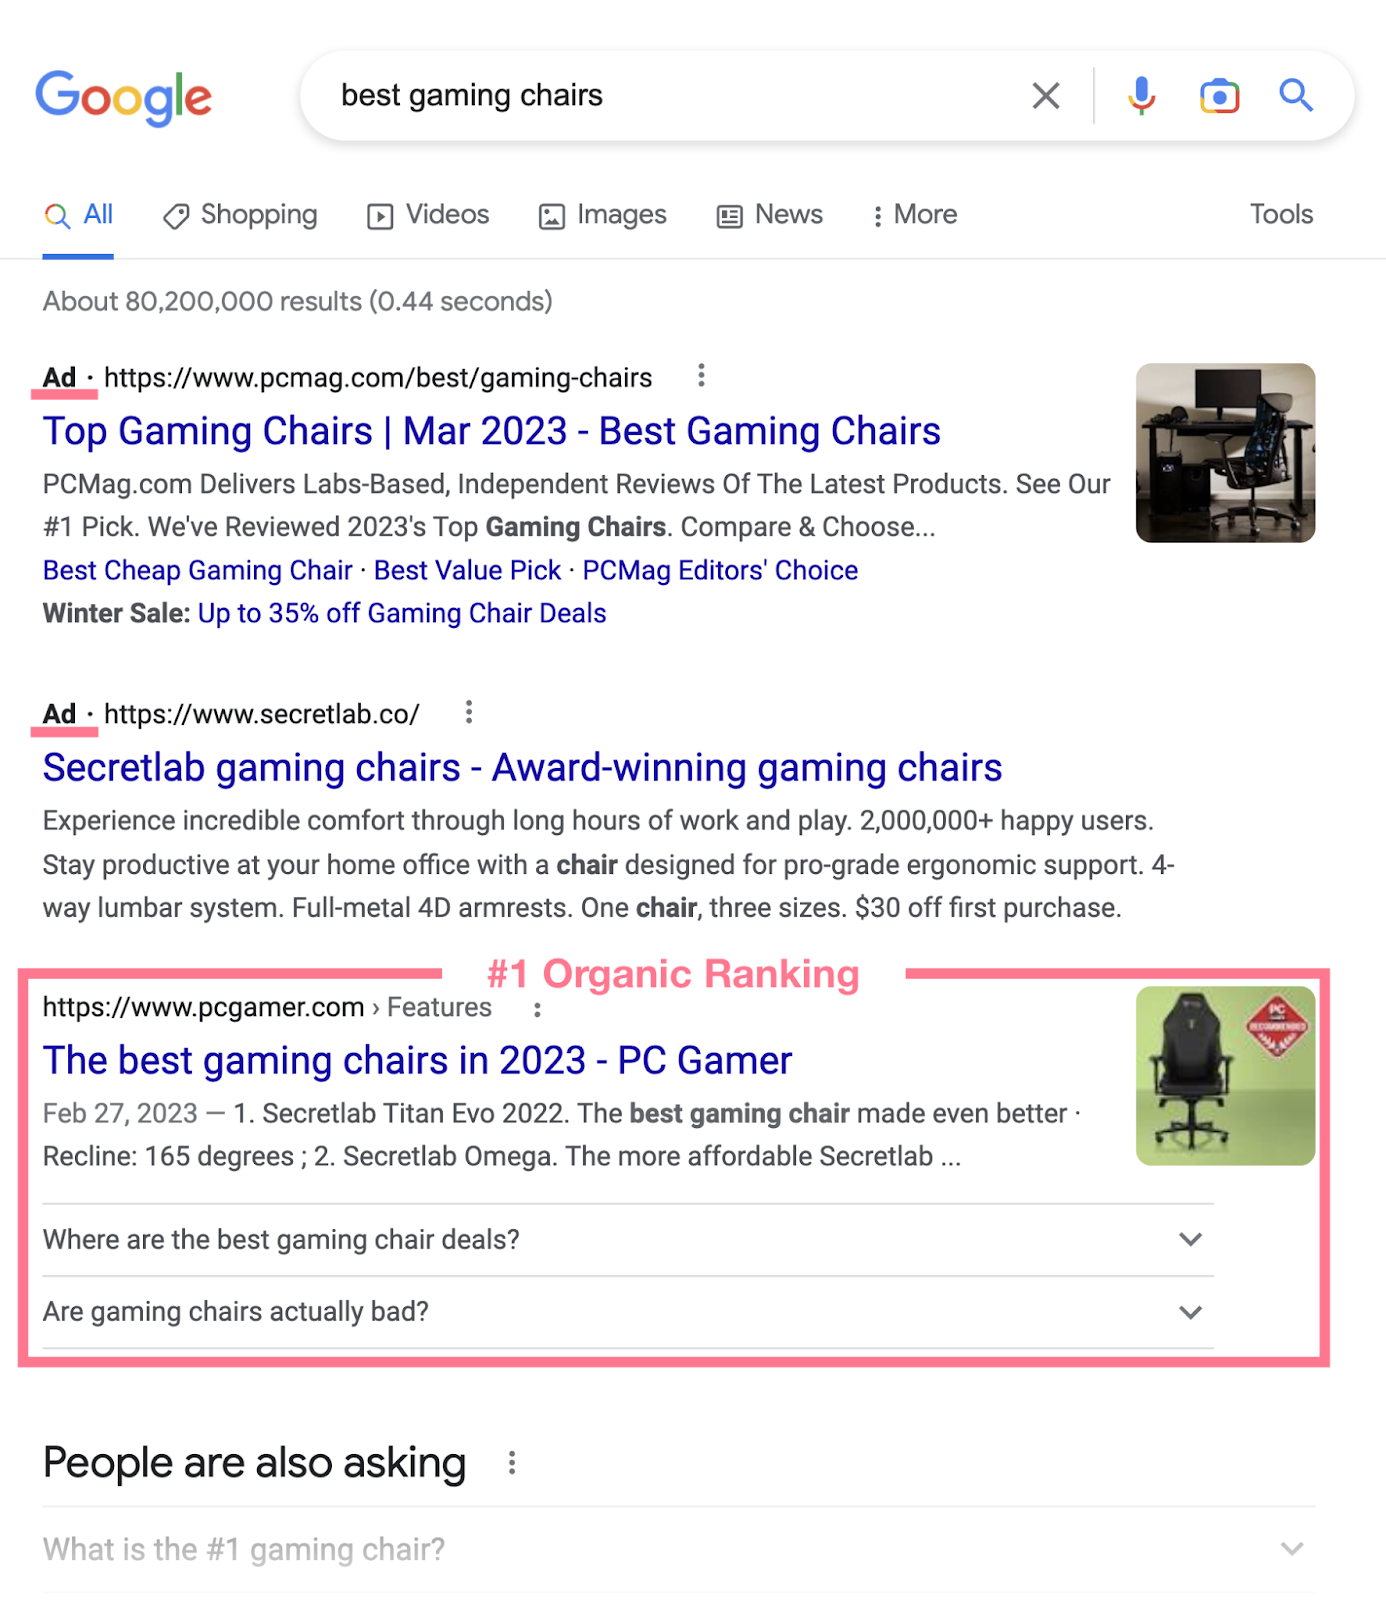
Organic click-through rate (CTR) measures the percentage of people who click on your result in the SERP out of how many people saw it.
Through this metric, you can assess how effective your title tags (HTML that specifies a page title and may show in search results) and meta descriptions (HTML that offers a brief page summary and may show in search results) are in grabbing searchers’ attention.
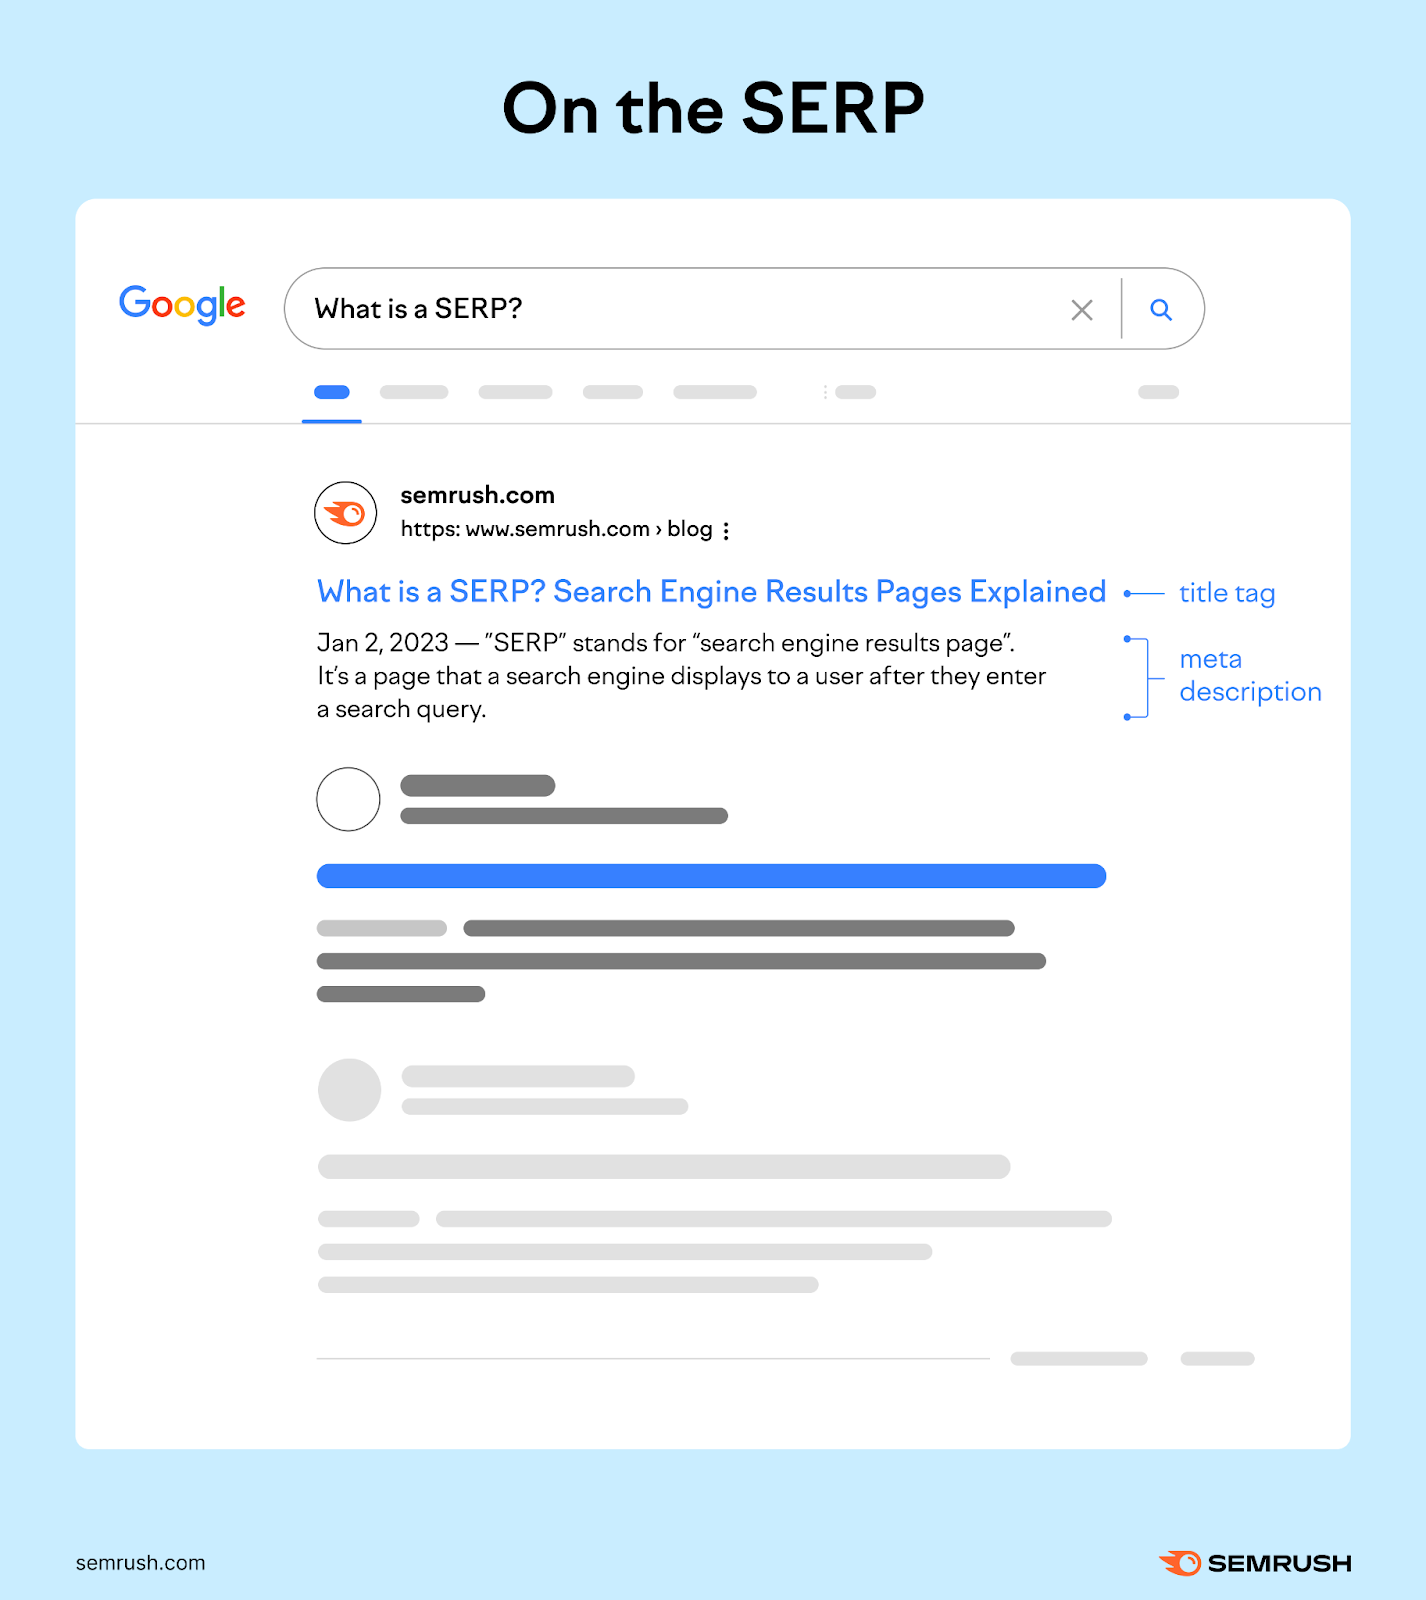
A higher CTR indicates that your title tags and meta descriptions are appealing and relevant to users’ search queries.
Bounce Rate
Bounce rate measures the percentage of unengaged sessions on your site. Which means a session didn’t last longer than 10 seconds, trigger a conversion event, or include another view.
This helps you evaluate whether your content is engaging enough to keep visitors on your site.
A high bounce rate may suggest your page content isn't that relevant or compelling enough to hold users’ interest.
Average Visit Duration
This metric measures how long visitors stay on your site. In GA4, it’s called “average engagement time.”
Longer visit durations typically indicate that your content is engaging and valuable to users.
Page Load Speed
Page load speed is how quickly a page’s content loads. Fast-loading pages enhance the user experience (UX) and can lead to better rankings.
There’s invariably going to be some amount of time required to fully load a page.

But maintaining fast loading times can increase your site’s visibility and keep visitors engaged.
Social Engagement
Social engagement is how many times your content receives an engagement such as a share, click, like, comment, etc. Which helps you understand how well your content resonates with audiences.
Plus, more engagement can mean more reach. Because when your followers interact with your posts, their social networks can also be exposed to them.
High social engagement can also send signals that indirectly boost your SEO performance.
How to Monitor Online Content
1. Analyze Competing Content
Analyzing your competitors’ content involves examining what topics they cover and how well their content performs. So you can identify gaps and opportunities in your strategy.
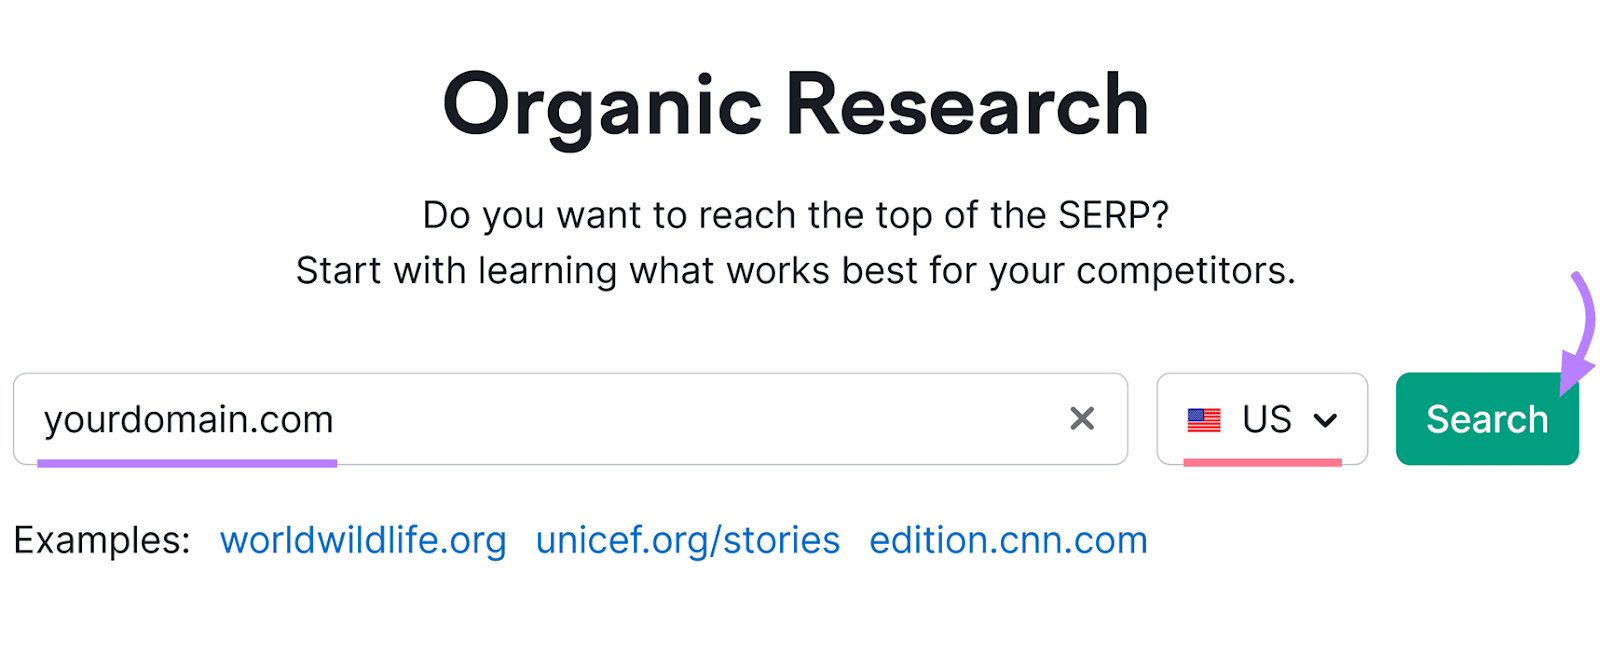
Begin by identifying who your main competitors are using Semrush’s Organic Research tool.
Enter your domain in the tool, choose your target location, and click “Search.”
You'll get an "Overview" report next.
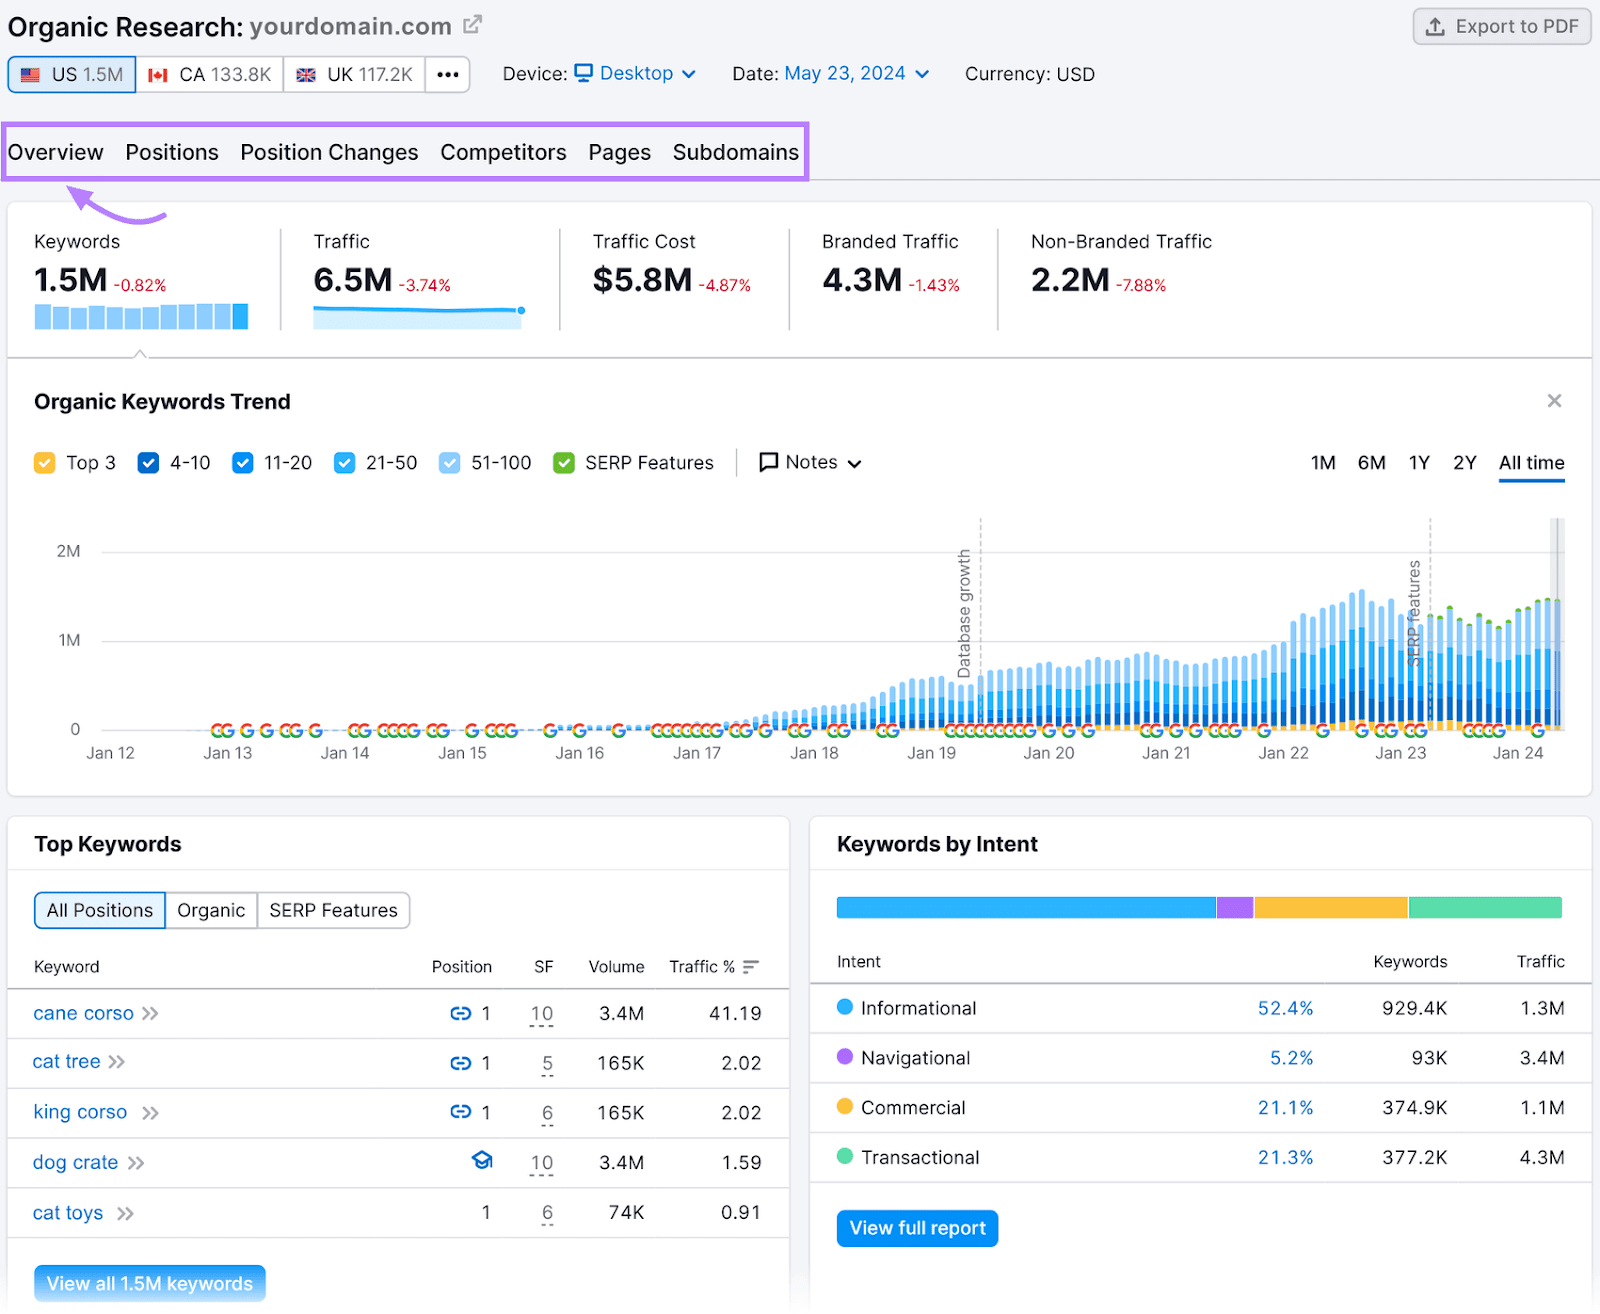
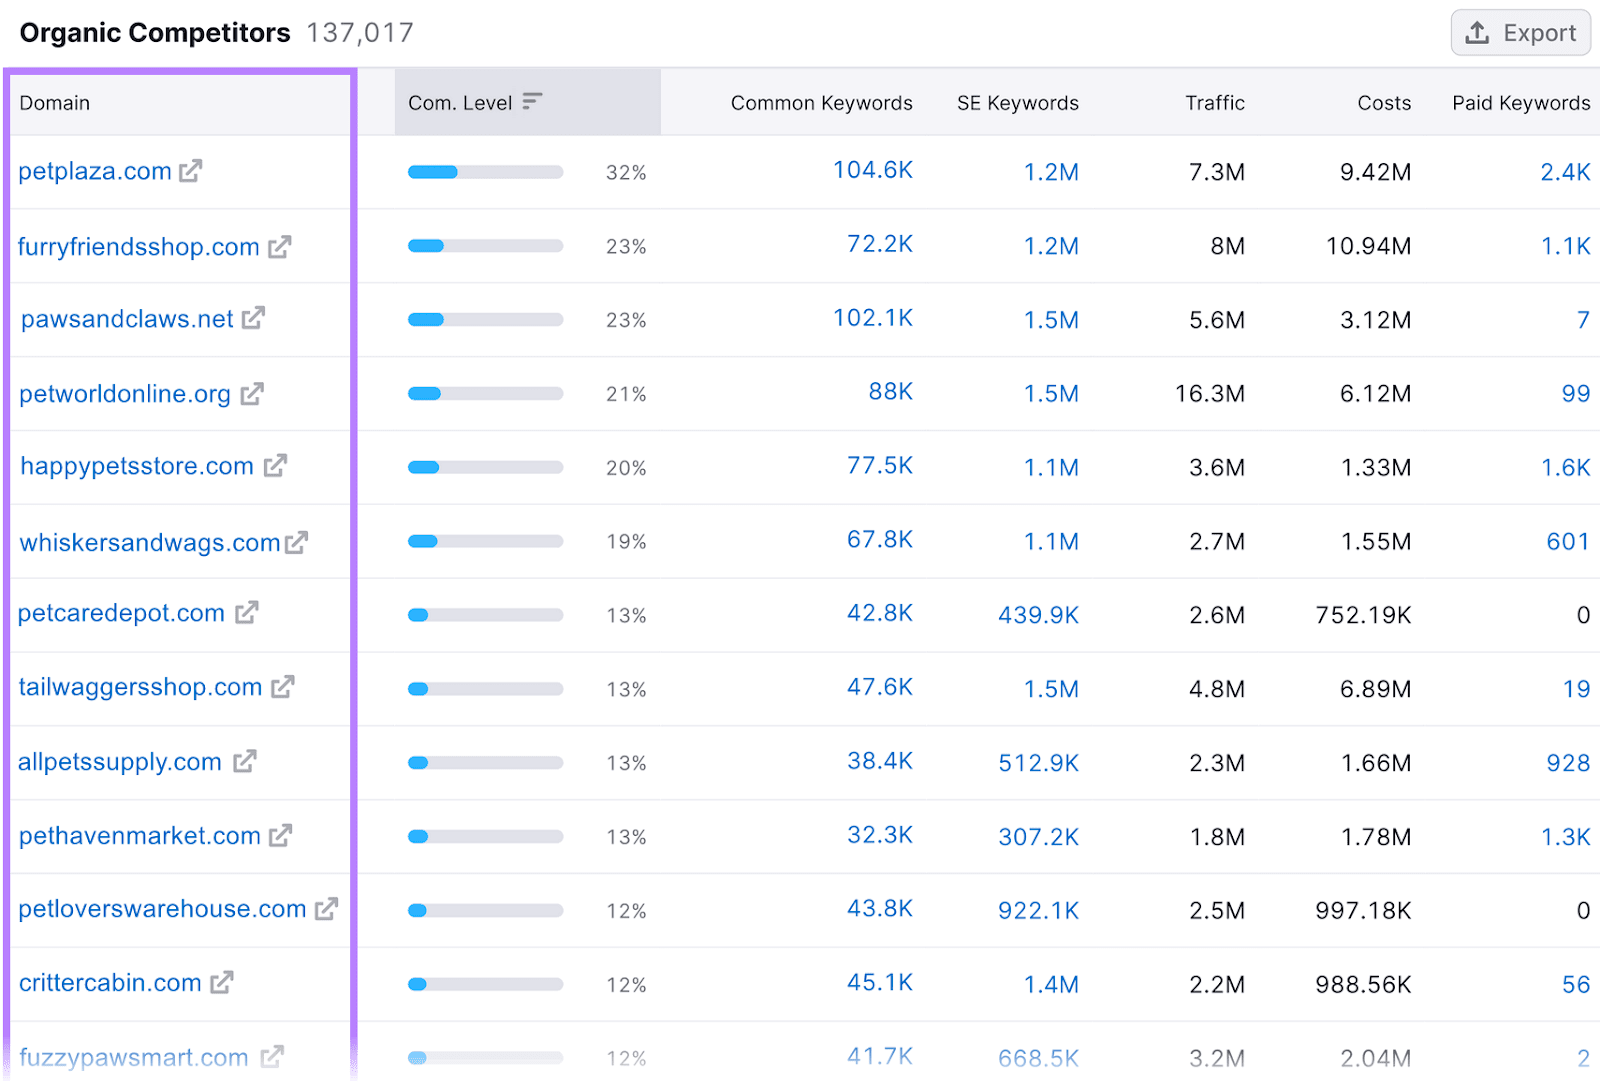
Head to the "Competitors" tab. Then, scroll down to see the list of domains your site competes with for organic search traffic.
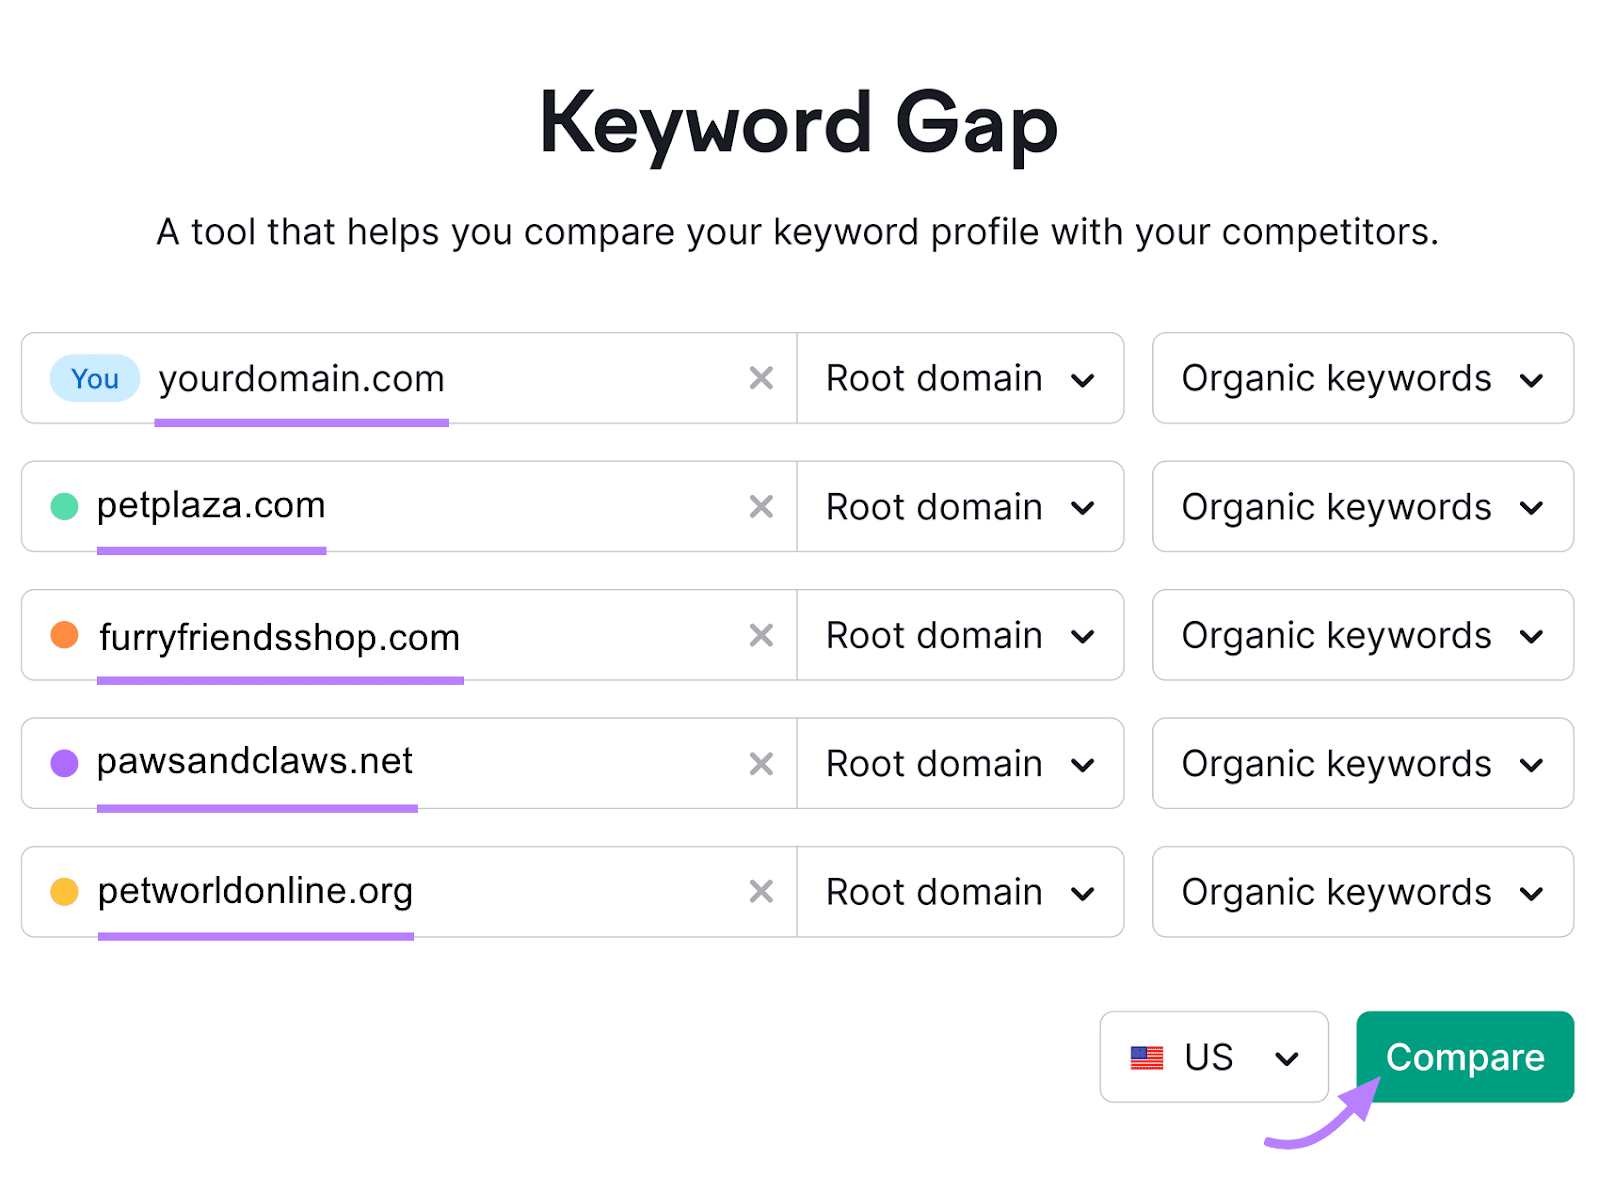
Next, use the Keyword Gap tool to compare your keyword profile with rival market players. To discover keyword opportunities you can use in your content.
Enter your and your top competitors' domains and click "Compare."
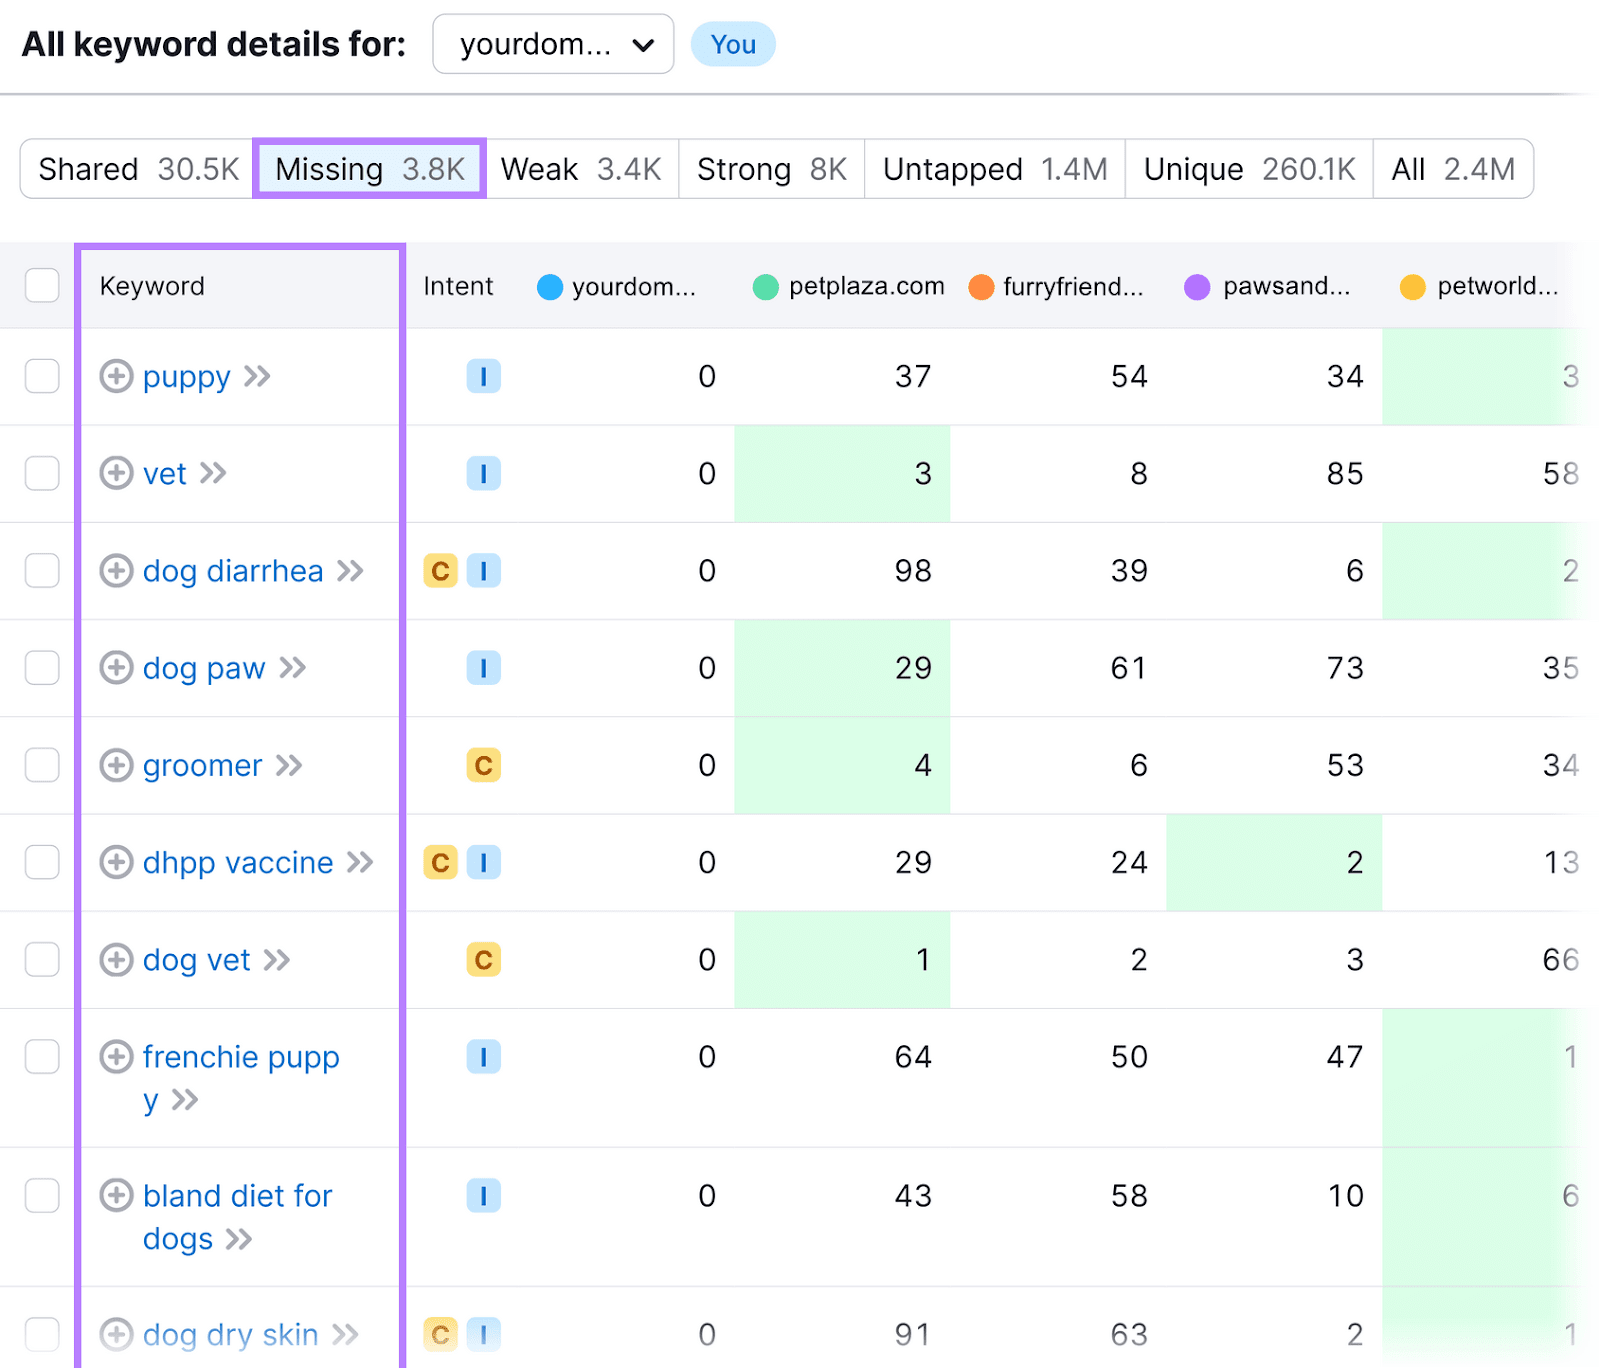
Toggle to the "Missing" tab to see which keywords your competitors rank for but you don't.
And check the "Weak" tab to show keywords you rank for but your competitors rank higher.
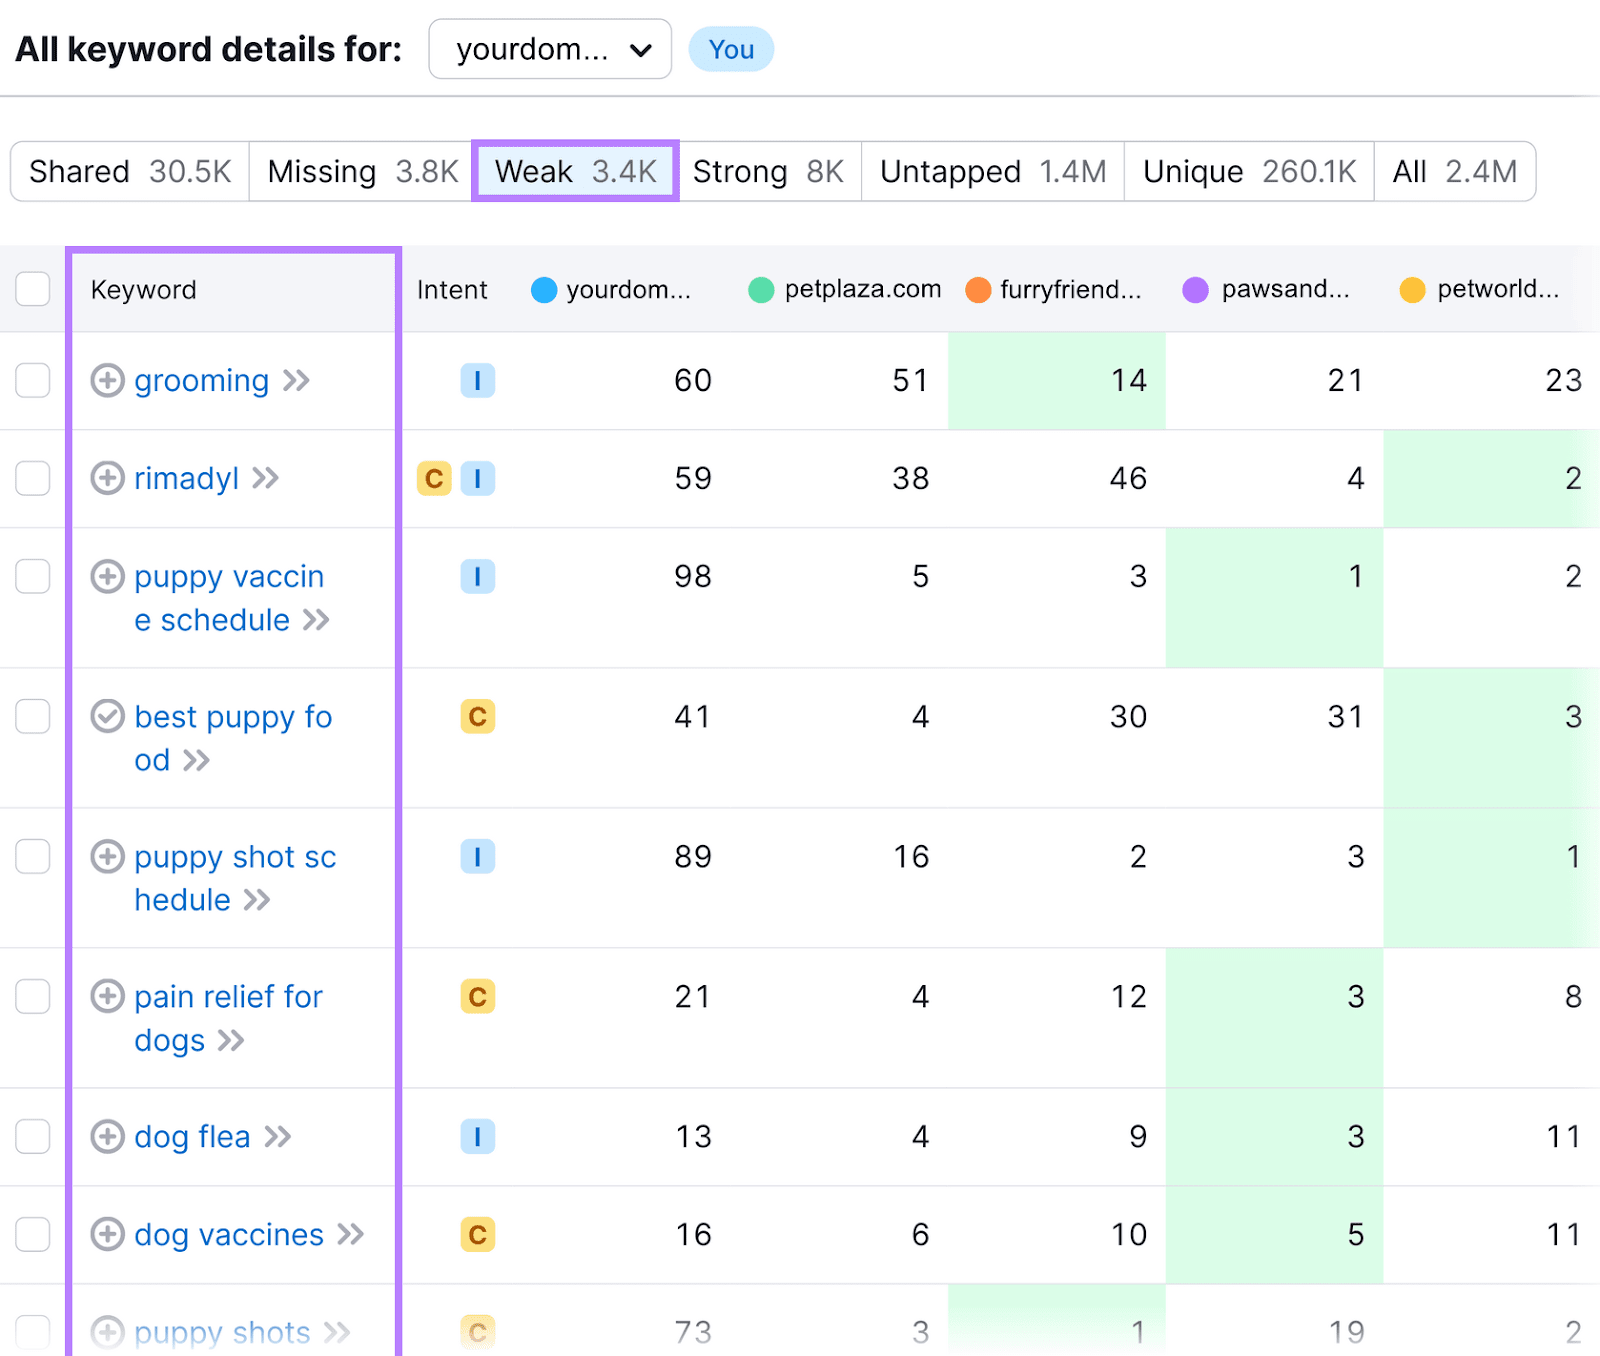
Go through these keyword lists to find relevant options. And consider each term’s “Volume” (the average number of searches it gets each month” and “KD%” (how difficult it will be to rank highly for that term) metrics to inform your choices.
For instance, say you find a keyword in the “Missing” tab with a high search volume and low competition level. This could be a prime candidate for new content creation.
Clicking on any of the terms you’re interested in will open up a report about it in Keyword Overview. Where you can see the top-ranking pages.
Visit these pages to learn what messaging they use, how extensively they cover the topic, etc. To get inspiration for creating better versions of those pieces.
2. Compile Performance Metrics
The next step is to gather your content monitoring metrics.
While the specifics metrics you track will depend on your goals, these categories are among the most important:
Keyword Positions
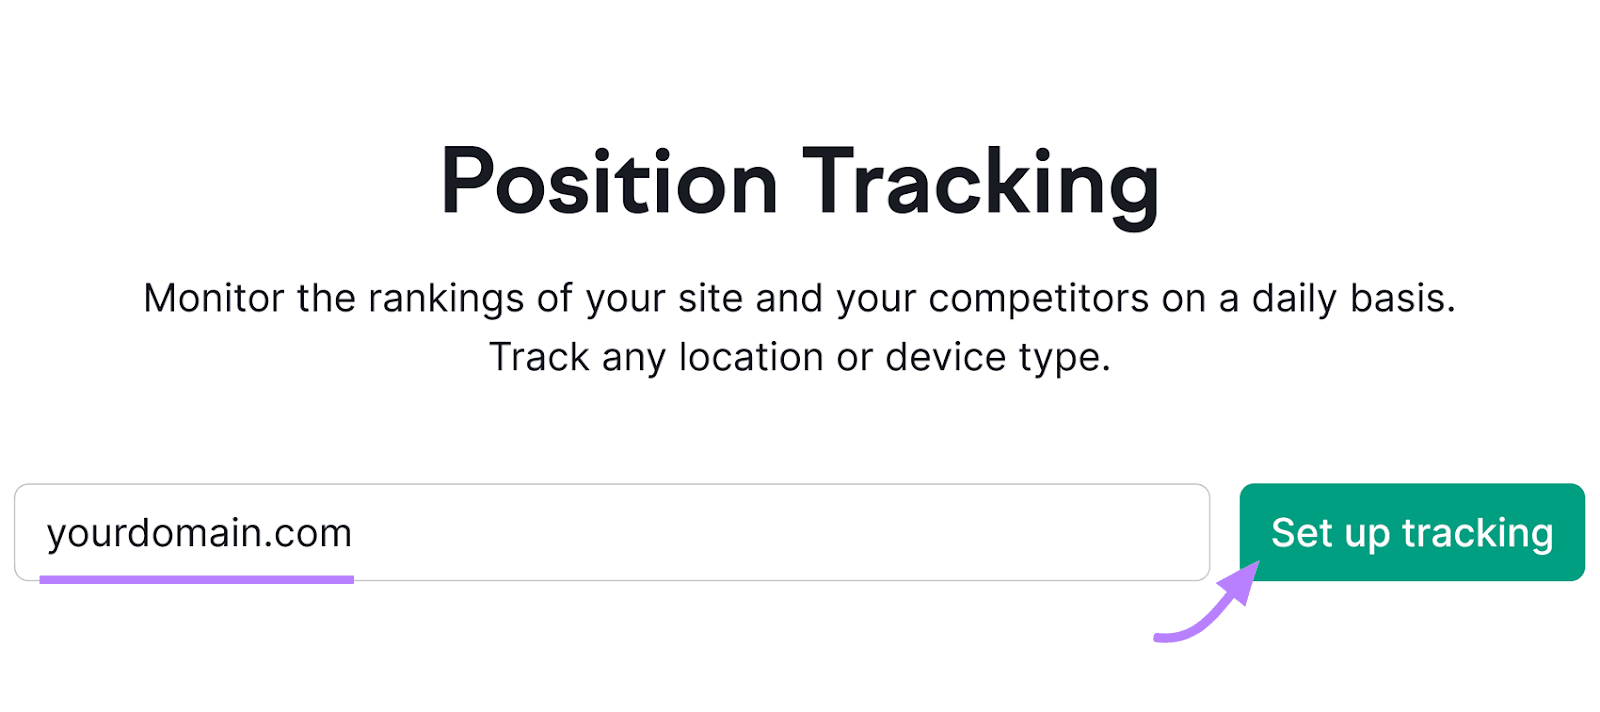
Use Semrush’s Position Tracking tool to analyze your keyword rankings against your competition. So you can identify weaknesses and stay on top of changes.
Enter your domain in the tool and click "Set up tracking."
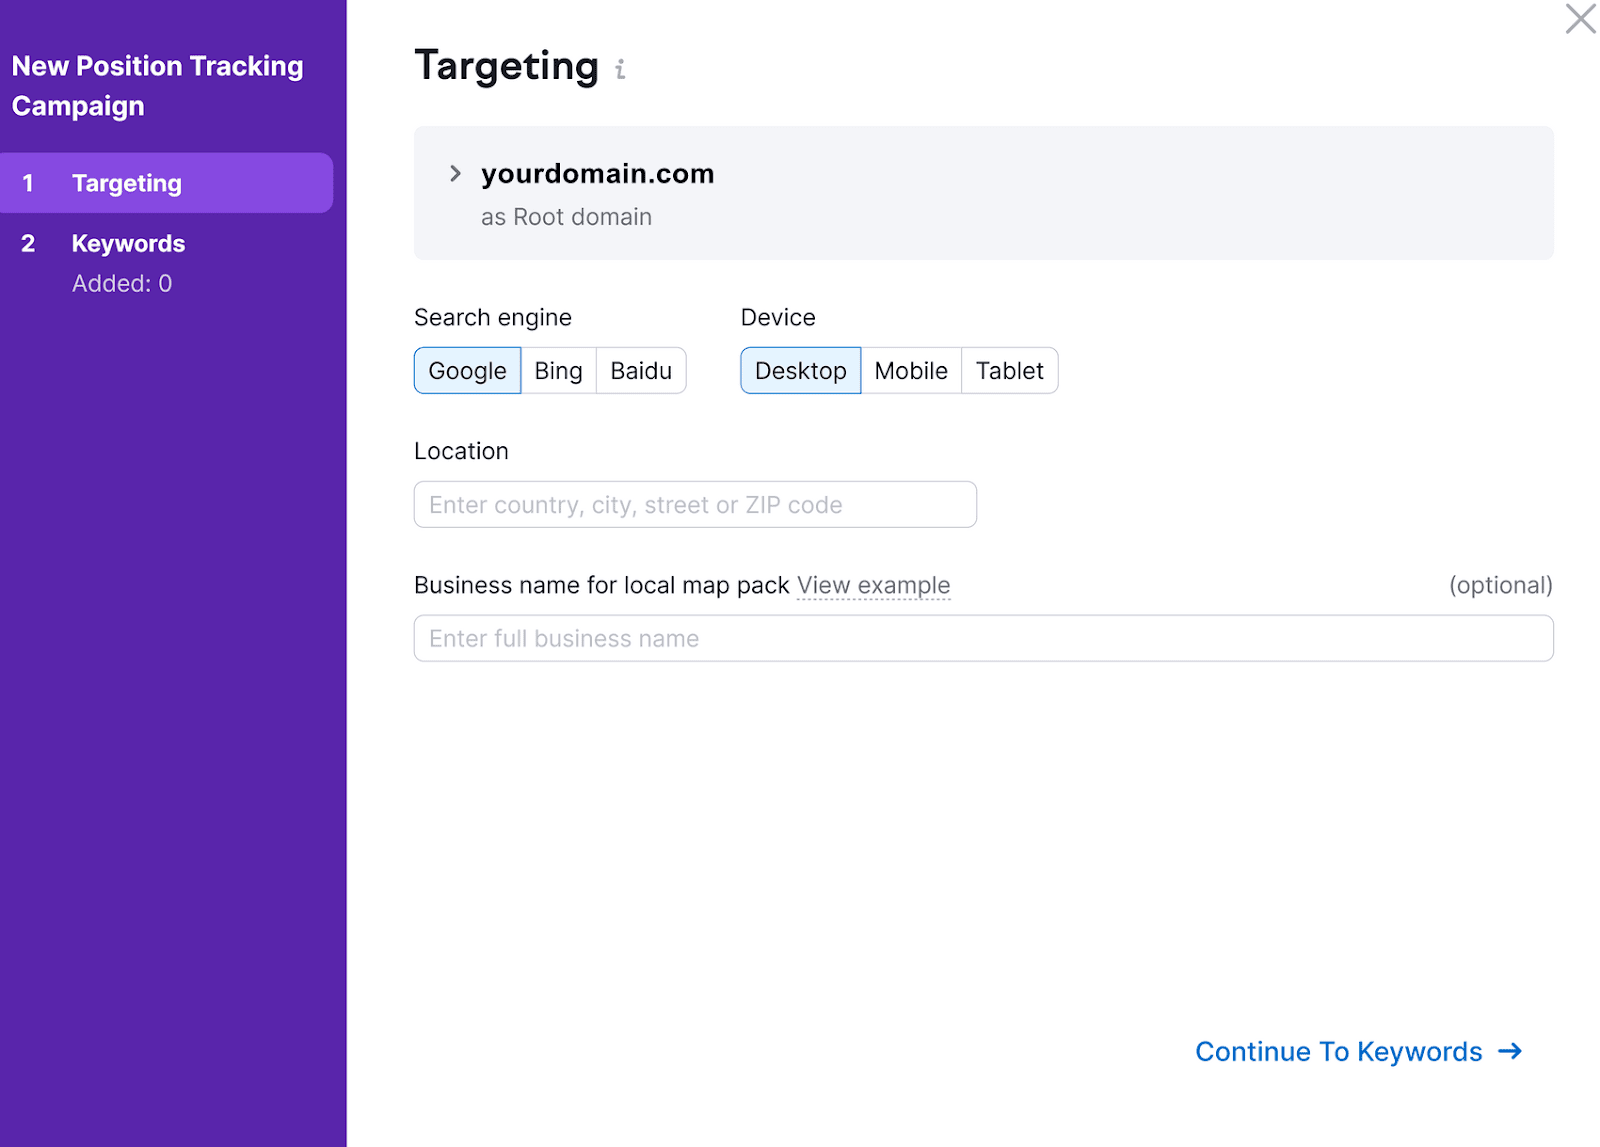
Follow the steps to configure your settings (see our Position Tracking setup guide if you need help).
Then, manually add or import the keywords you’re looking to monitor.
A dashboard for the campaign you’ve just set up will appear next.
Head to the “Overview” tab.
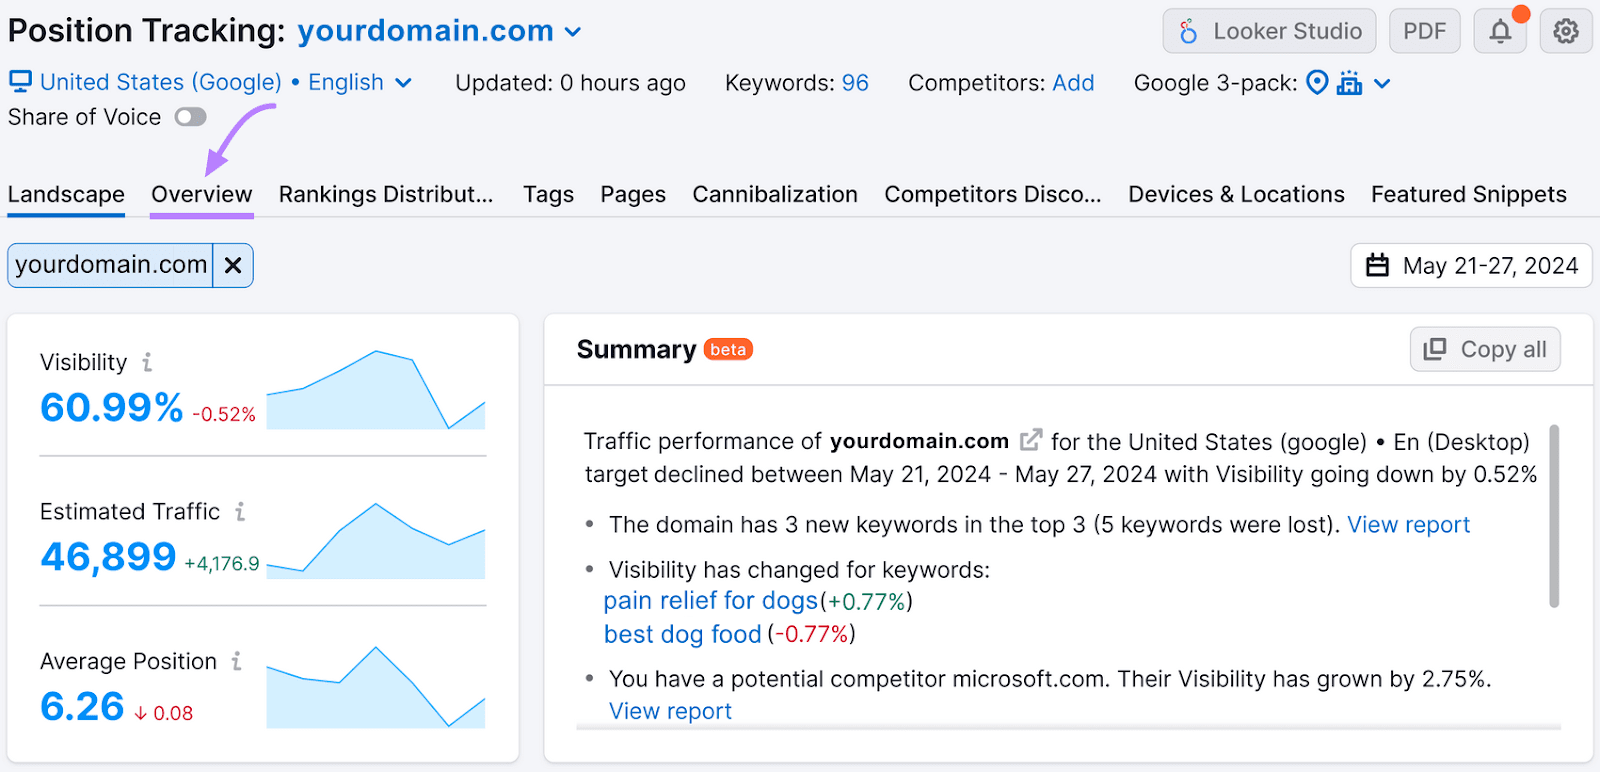
You’ll see a “Visibility” chart. Which measures your website’s progress in Google’s top 100 for the keywords in your campaign.
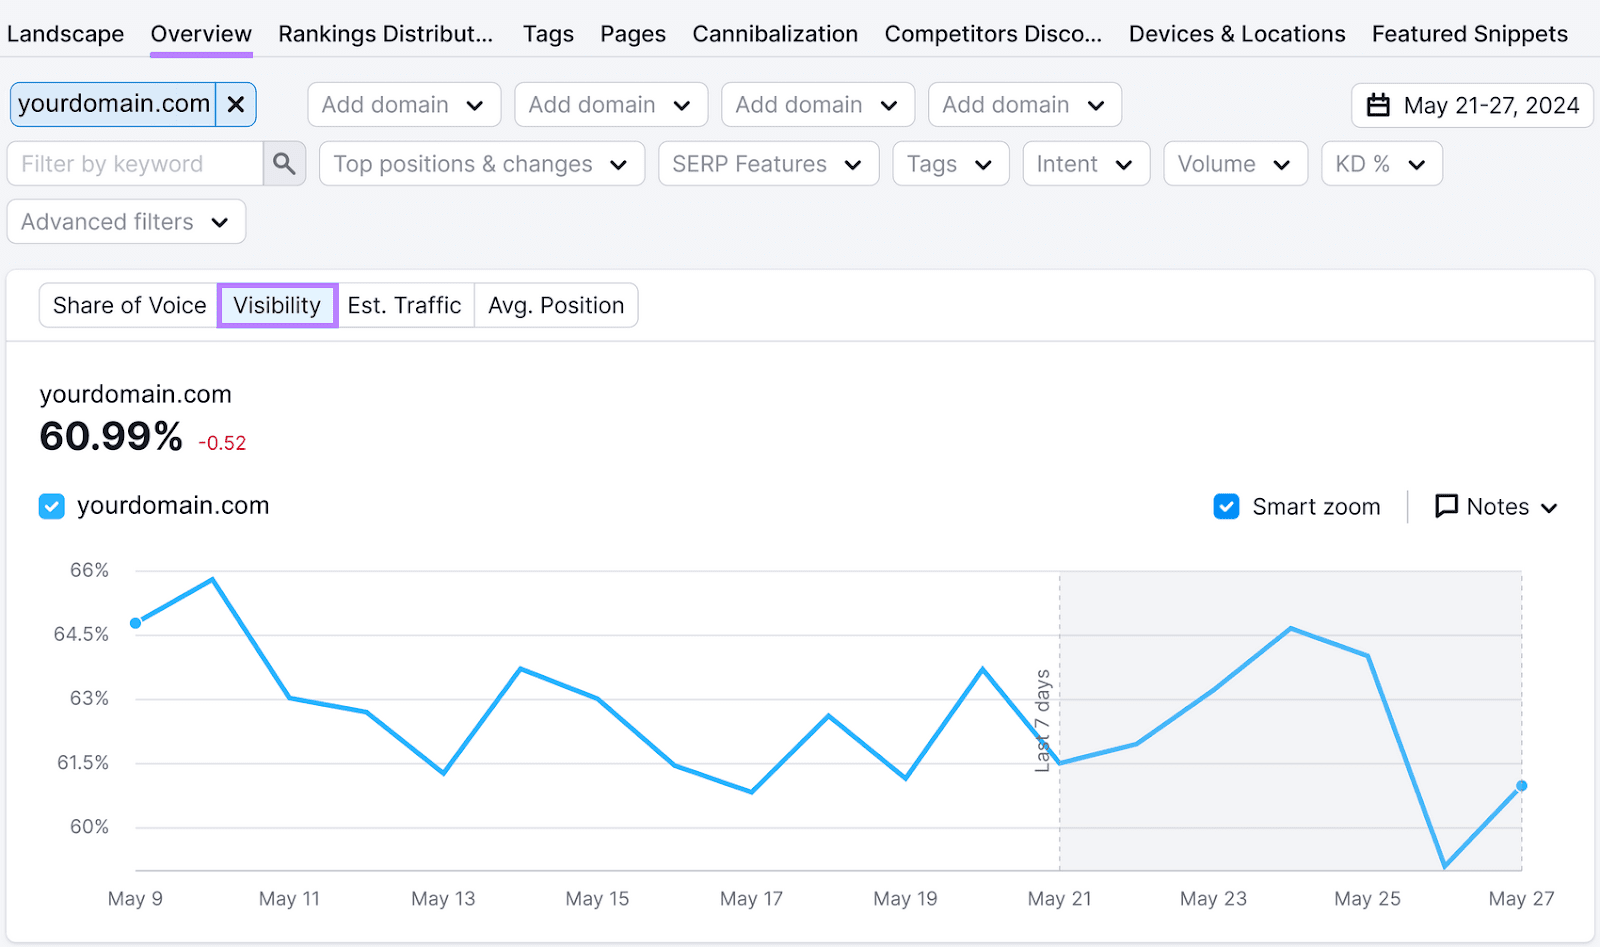
The higher the percentage, the more visibility your site has.
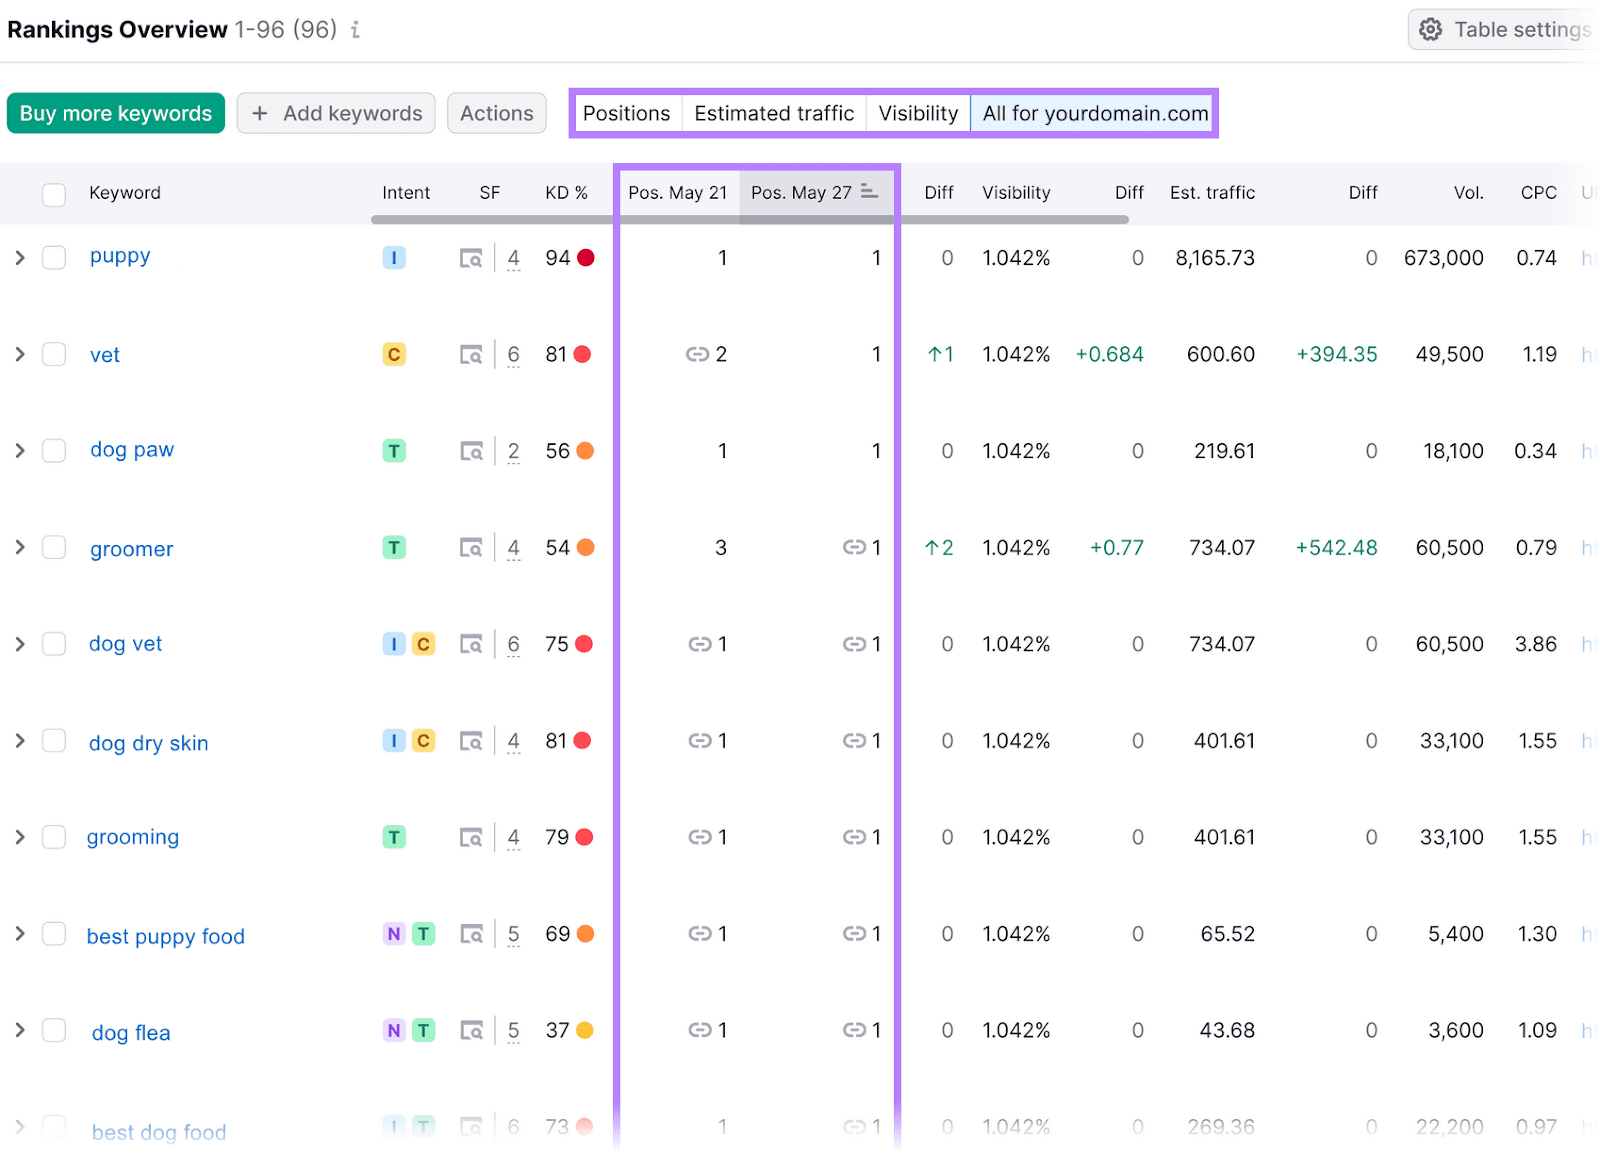
Below, the “Rankings Overview” section shows your keyword positions now and for the last period.
You can also compare yourself against your competitors at the keyword level.
Go back to the “Landscape” tab and click "Competitors: Add" at the top of the tool dashboard.
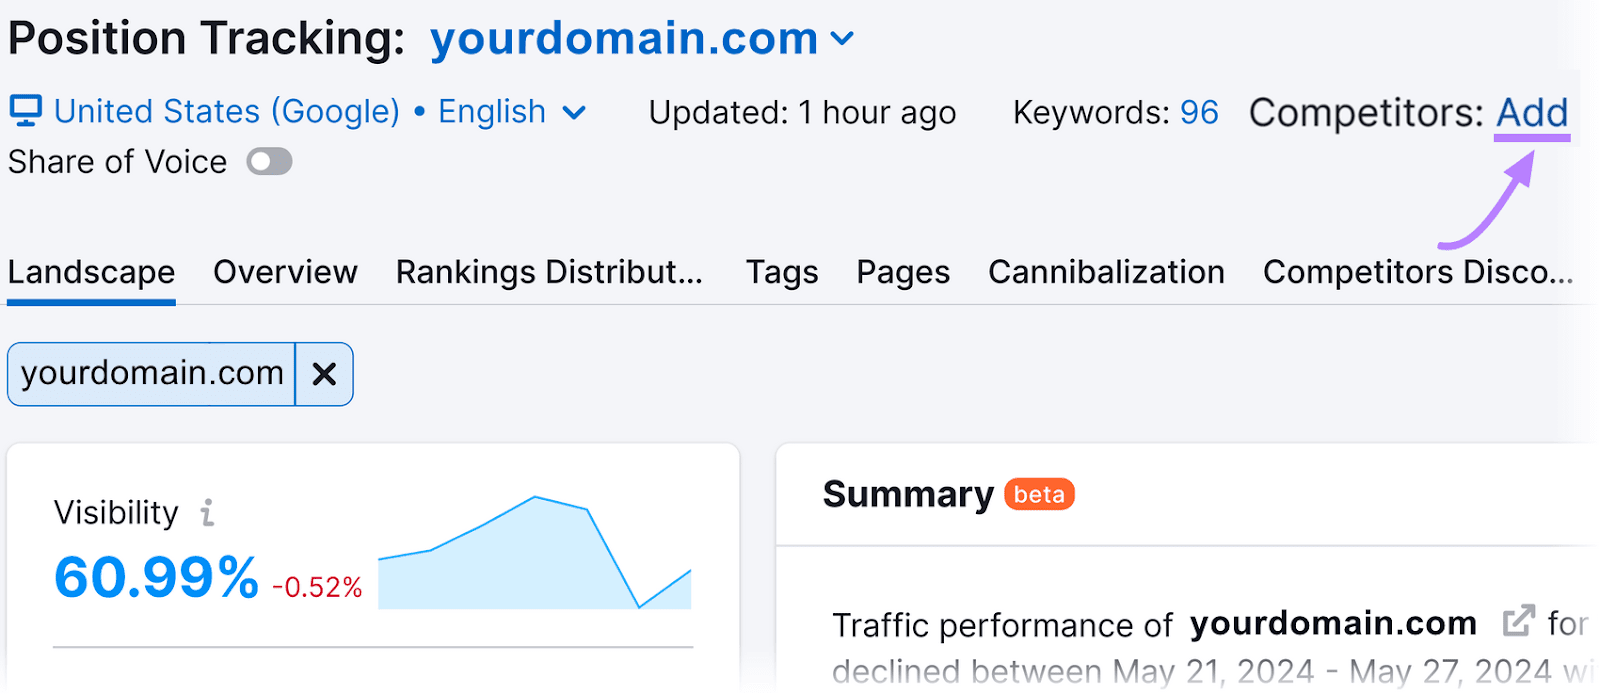
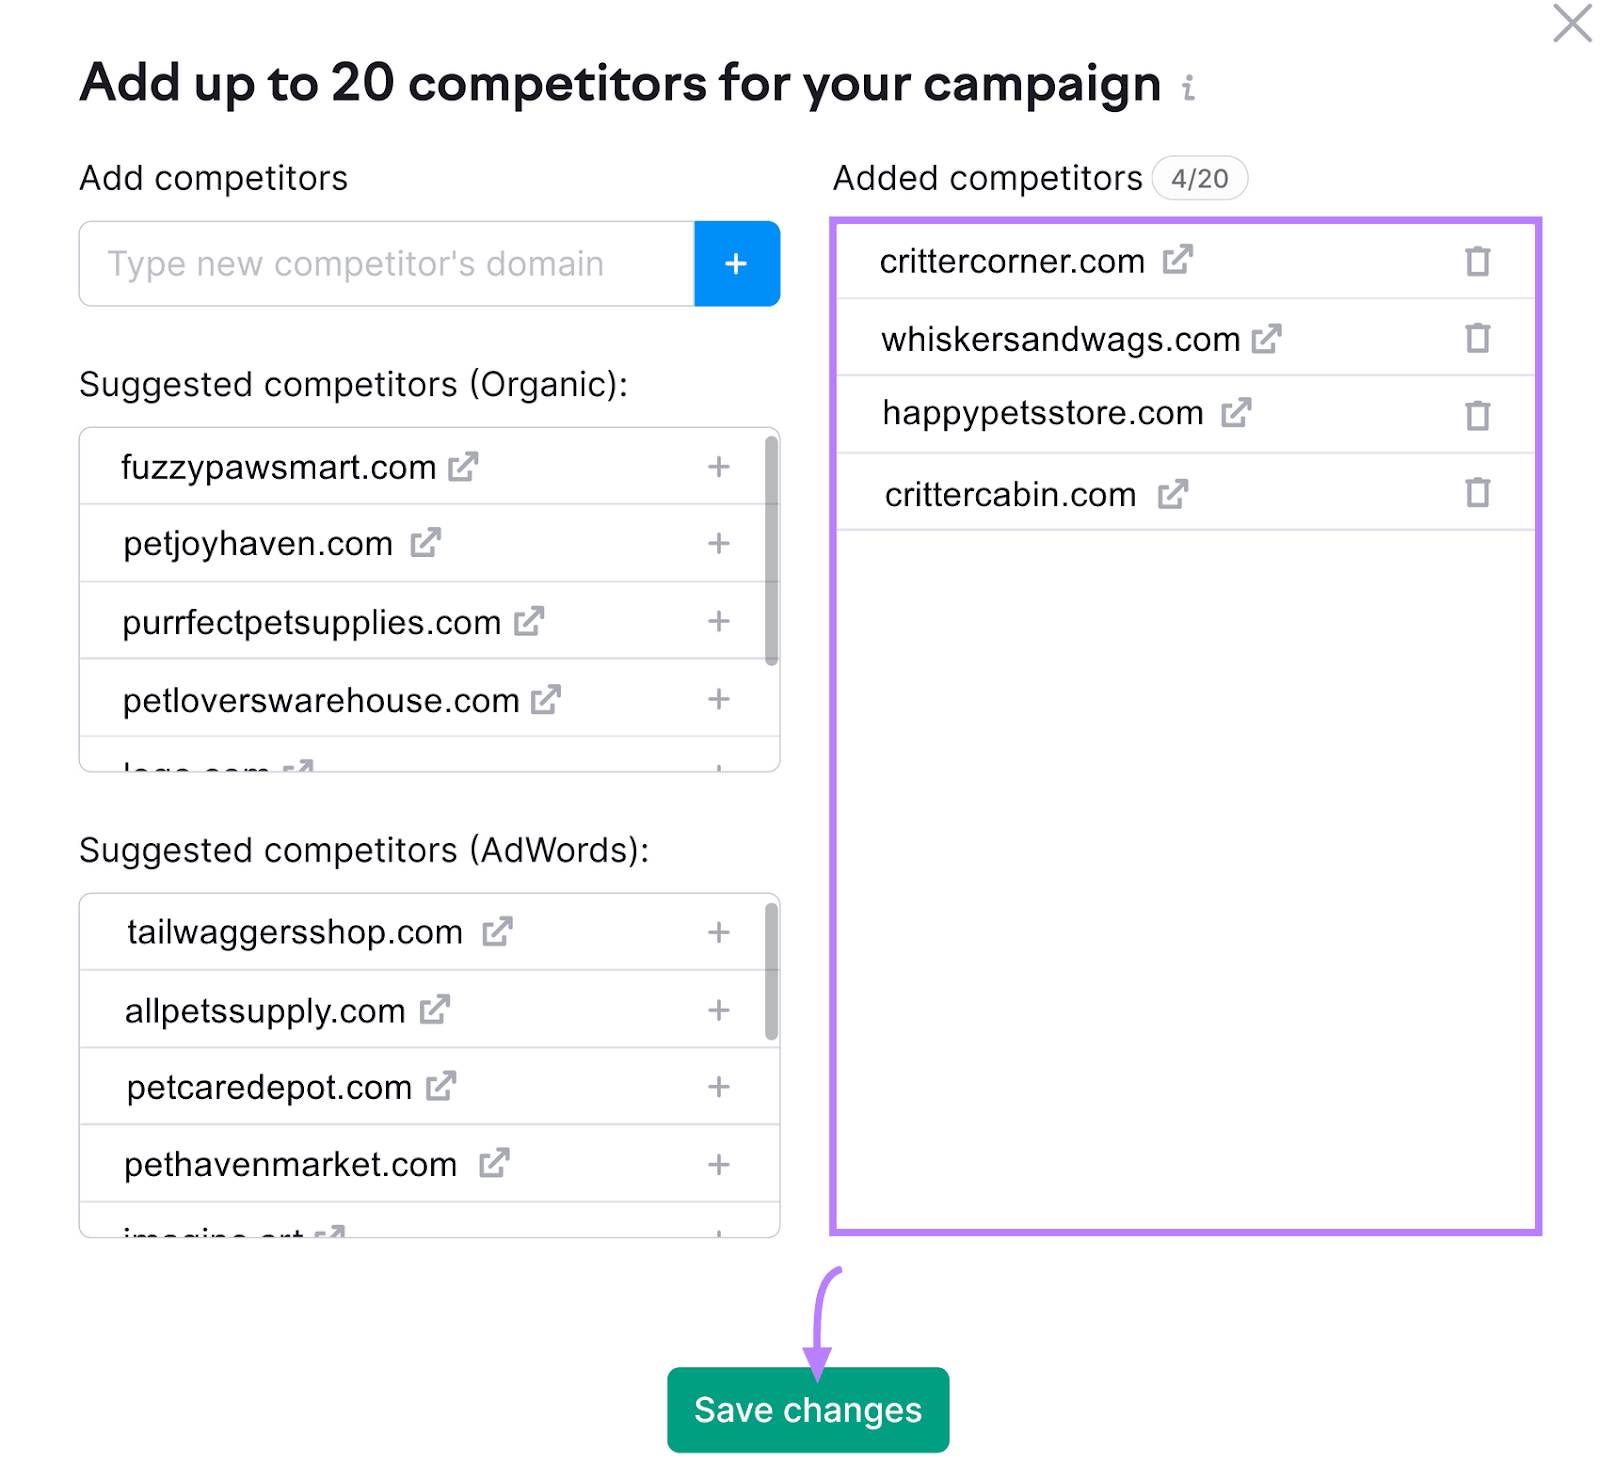
You can add up to 20 competitors. Then, hit the "Save changes" button.
Pick up to four competitors at a time using the “Add domain” drop-downs at the top of the “Overview” page.
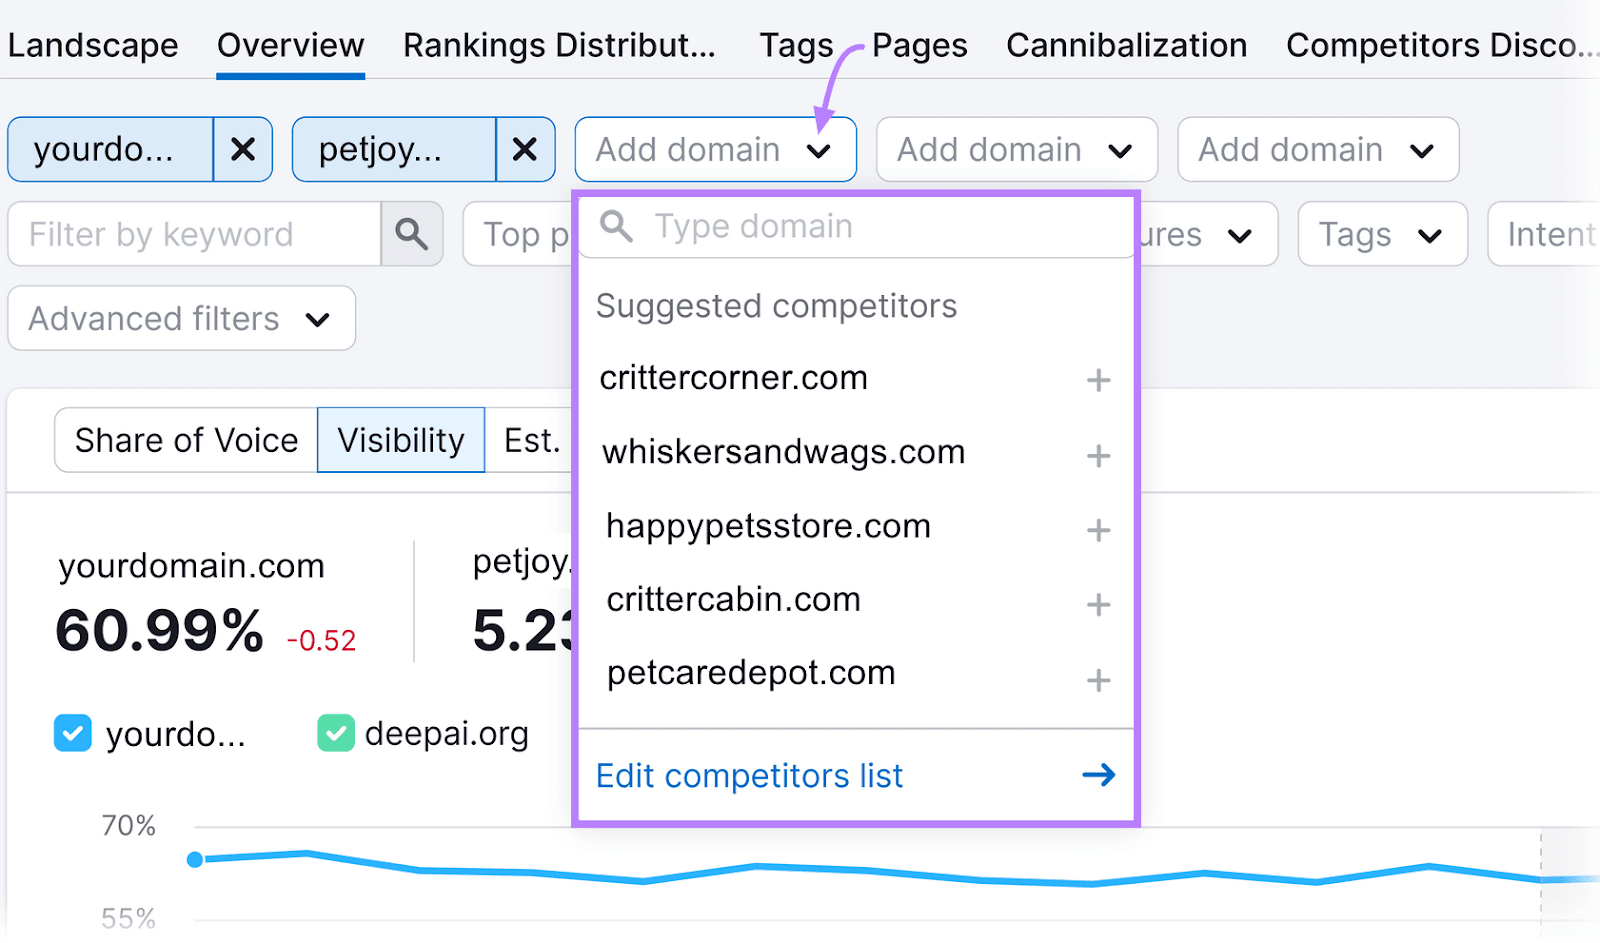
You’ll be able to see how your site performs against the selected domains for each of your keywords.
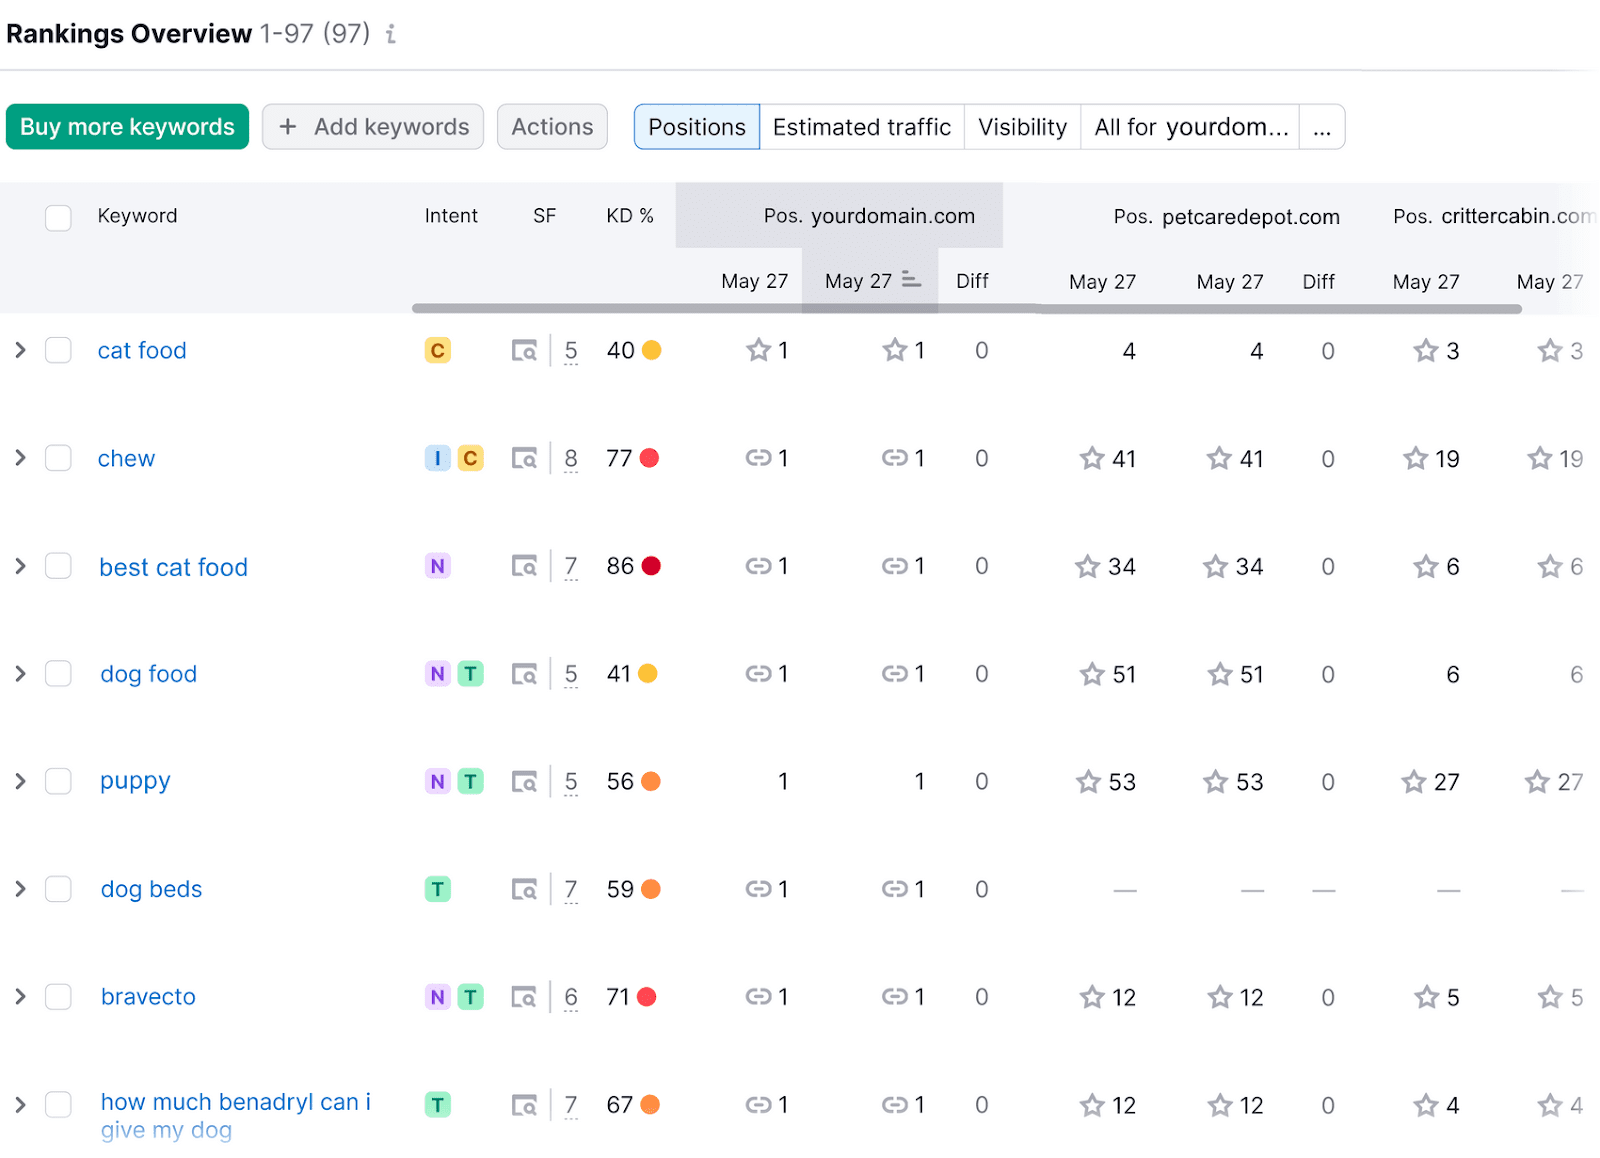
Note where you’re outperforming your competition. And identify which keywords need more attention to enhance your site's visibility and compete more effectively.
Traffic Metrics
Next, use Semrush’s Traffic Analytics to monitor your traffic metrics alongside your competitors’ metrics.
In the tool, enter your and your competitors' domains (up to four). And click "Analyze."
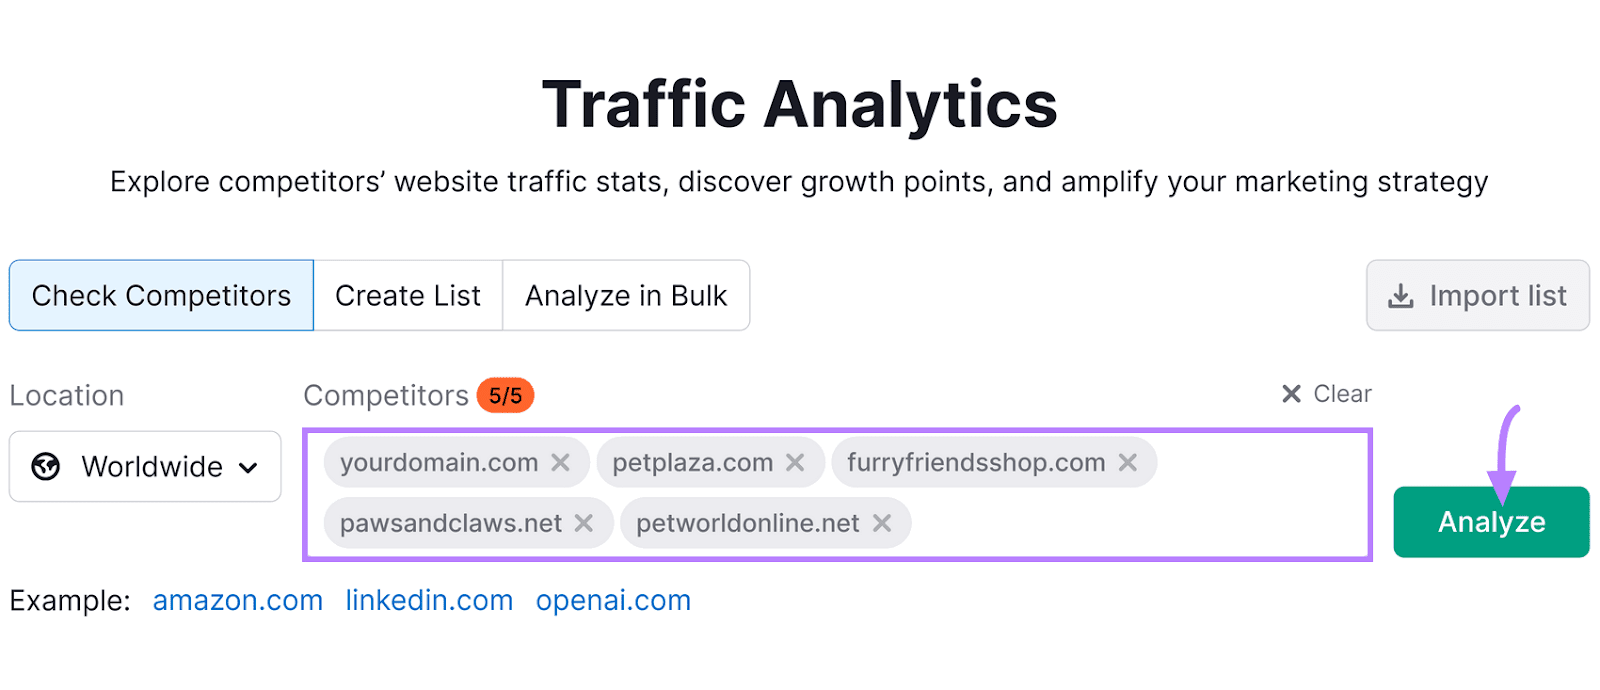
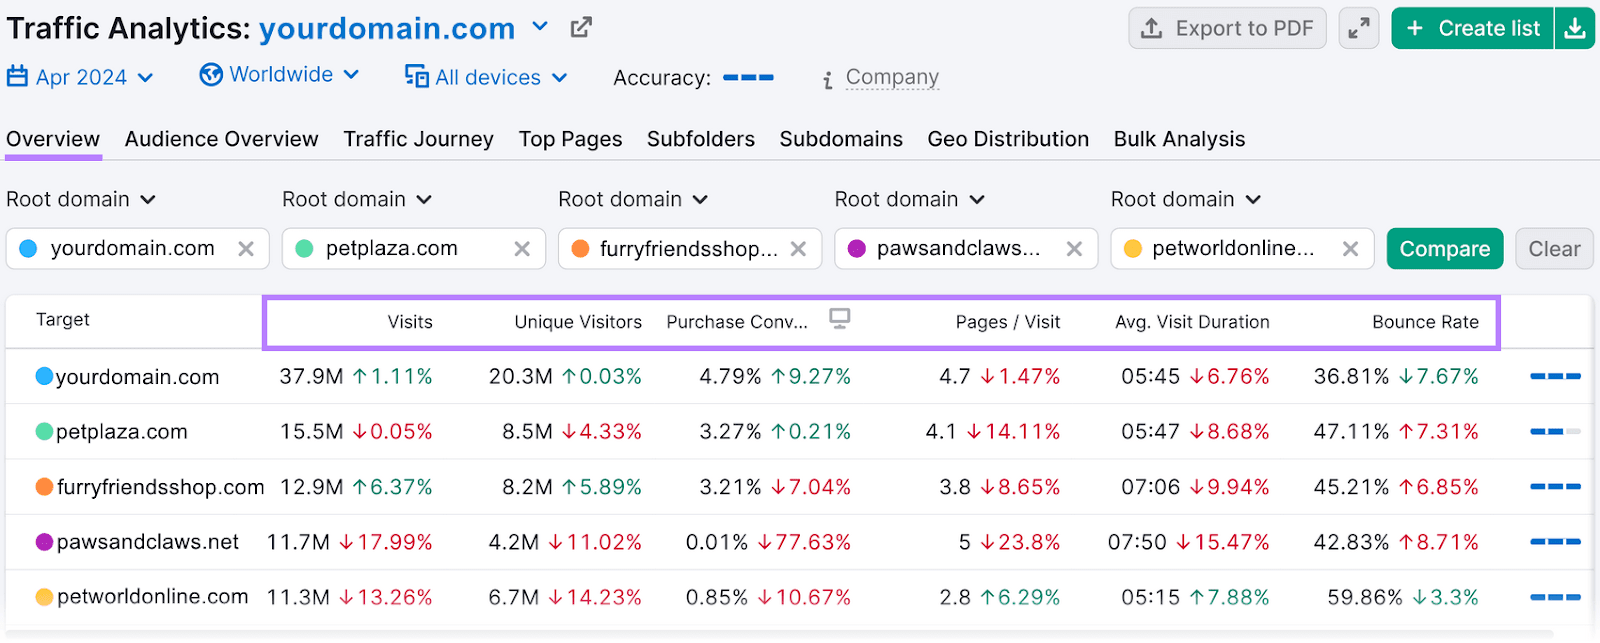
The “Overview” report will show you essential metrics for all domains. Like visits, unique visitors, bounce rate, and average visit duration.
Use these metrics to identify your strengths and weaknesses.
In this case, it’s clear that the focus domain is outperforming rivals in terms of visits. Indicating it excels are attracting users to the site.
But the average visit duration is low when compared to most competitors. Suggesting there’s room to improve content to be more relevant and engaging.
Next, go to the “Audience Overview” report to review demographic and socioeconomic data about visitors to the different websites.
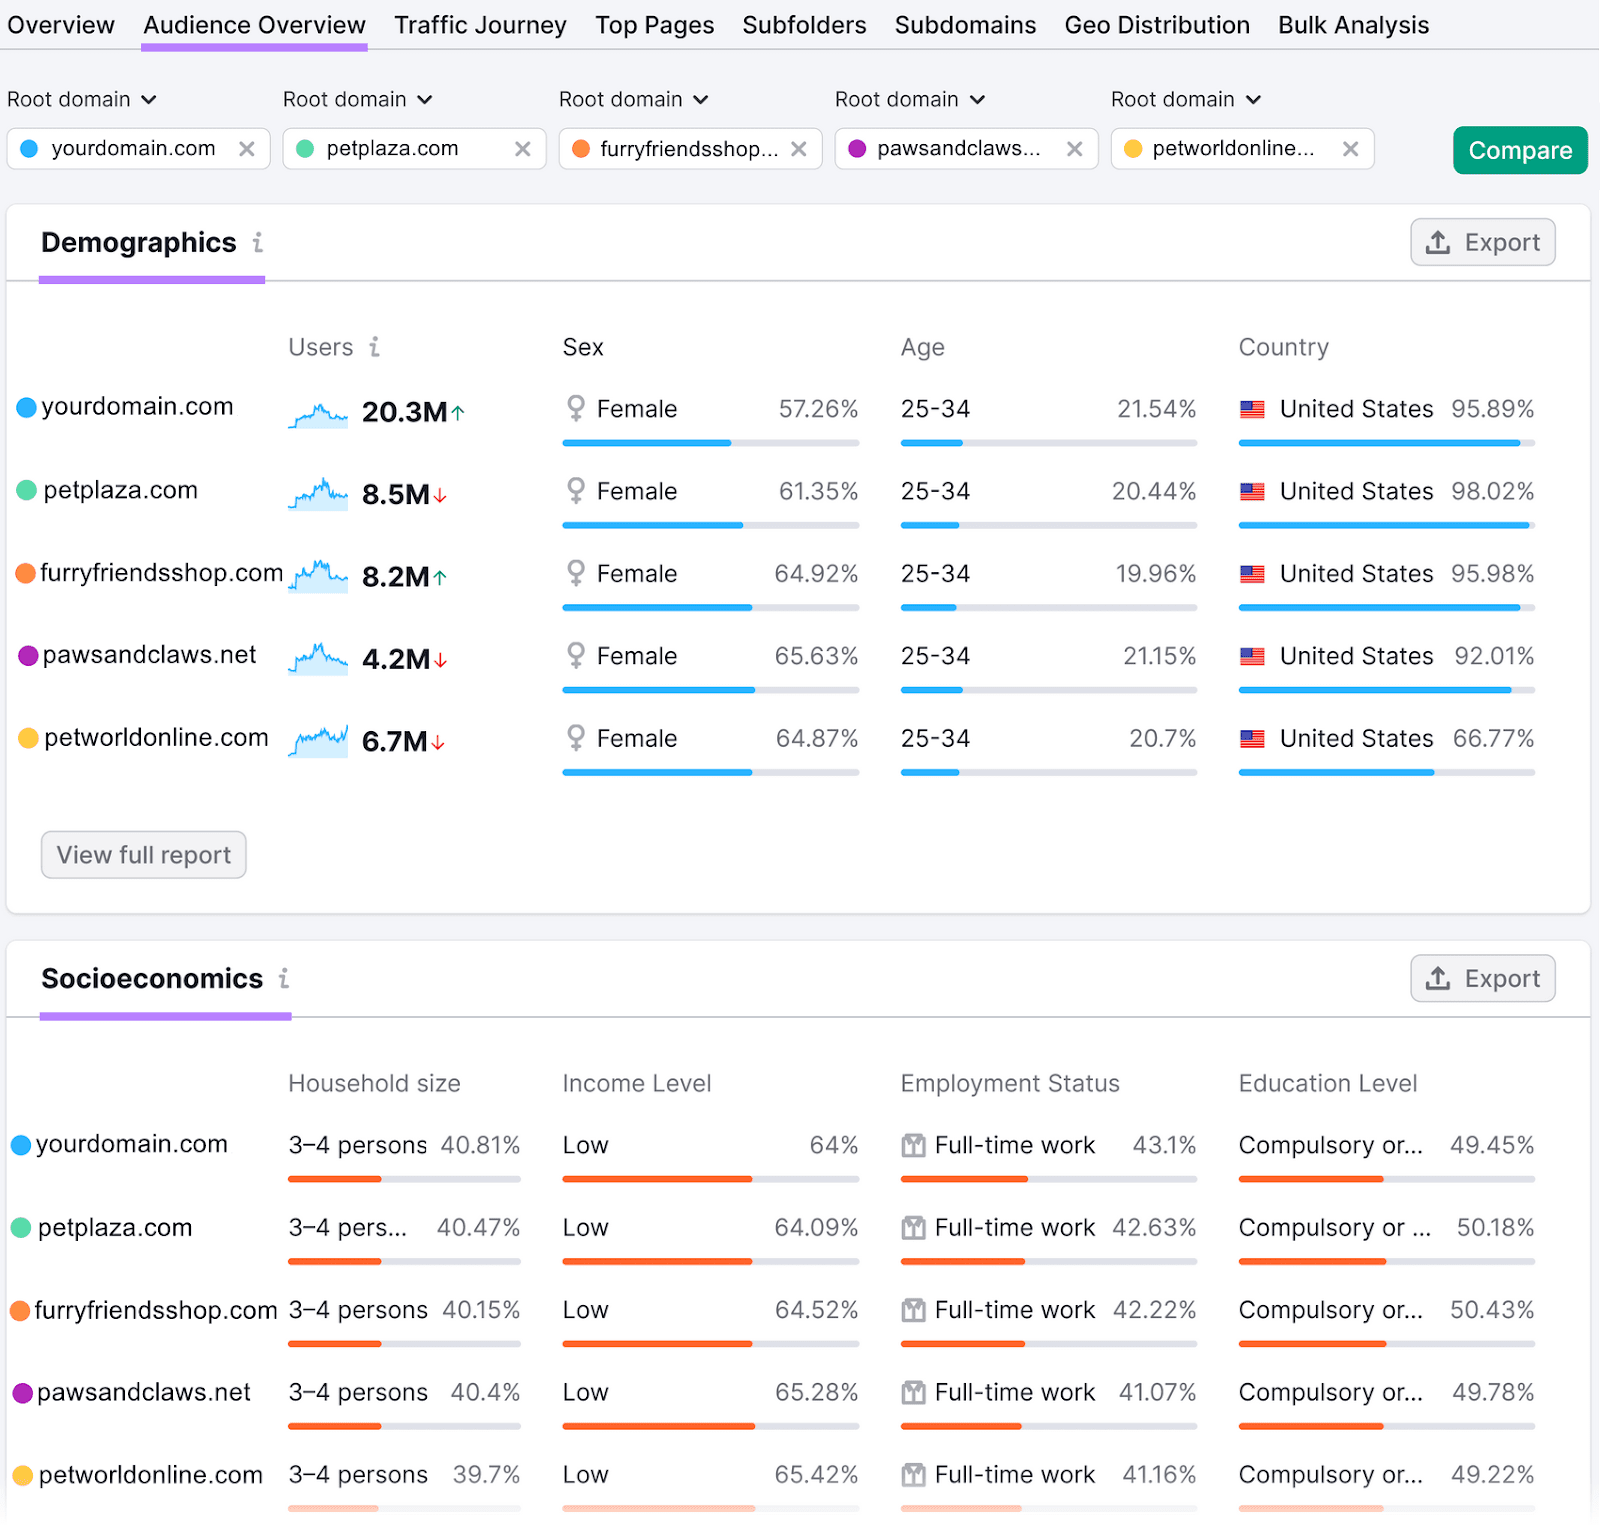
This can help you identify the specific interests and needs of your audience. Guiding you to create more relevant and appealing content.
3. Determine Next Steps
After you’ve collected data about your content performance and your competitors’ content performance, take some time to analyze the results.
Are there areas where you’re outperforming them? If so, consider why that is. So you can continue to see success.
If you notice your rivals are outperforming you across certain metrics, revisit the analysis you did in the first step.
Let’s say your website engagement metrics are low compared to your competitors. And that you noticed their content has more imagery, offers additional resources, and covers topics more thoroughly.
That reveals some clear ways you can improve your content going forward.
4. Create and Optimize Content
You now have a sense of what you need to do to improve your content. And which keywords you could use to help.
It’s usually a good idea to start with existing content you can optimize rather than creating new pieces. Because it often takes less time and could drive results faster.
Use On-Page SEO Checker to help.
Start by configuring the tool for your site (follow this setup guide for assistance).
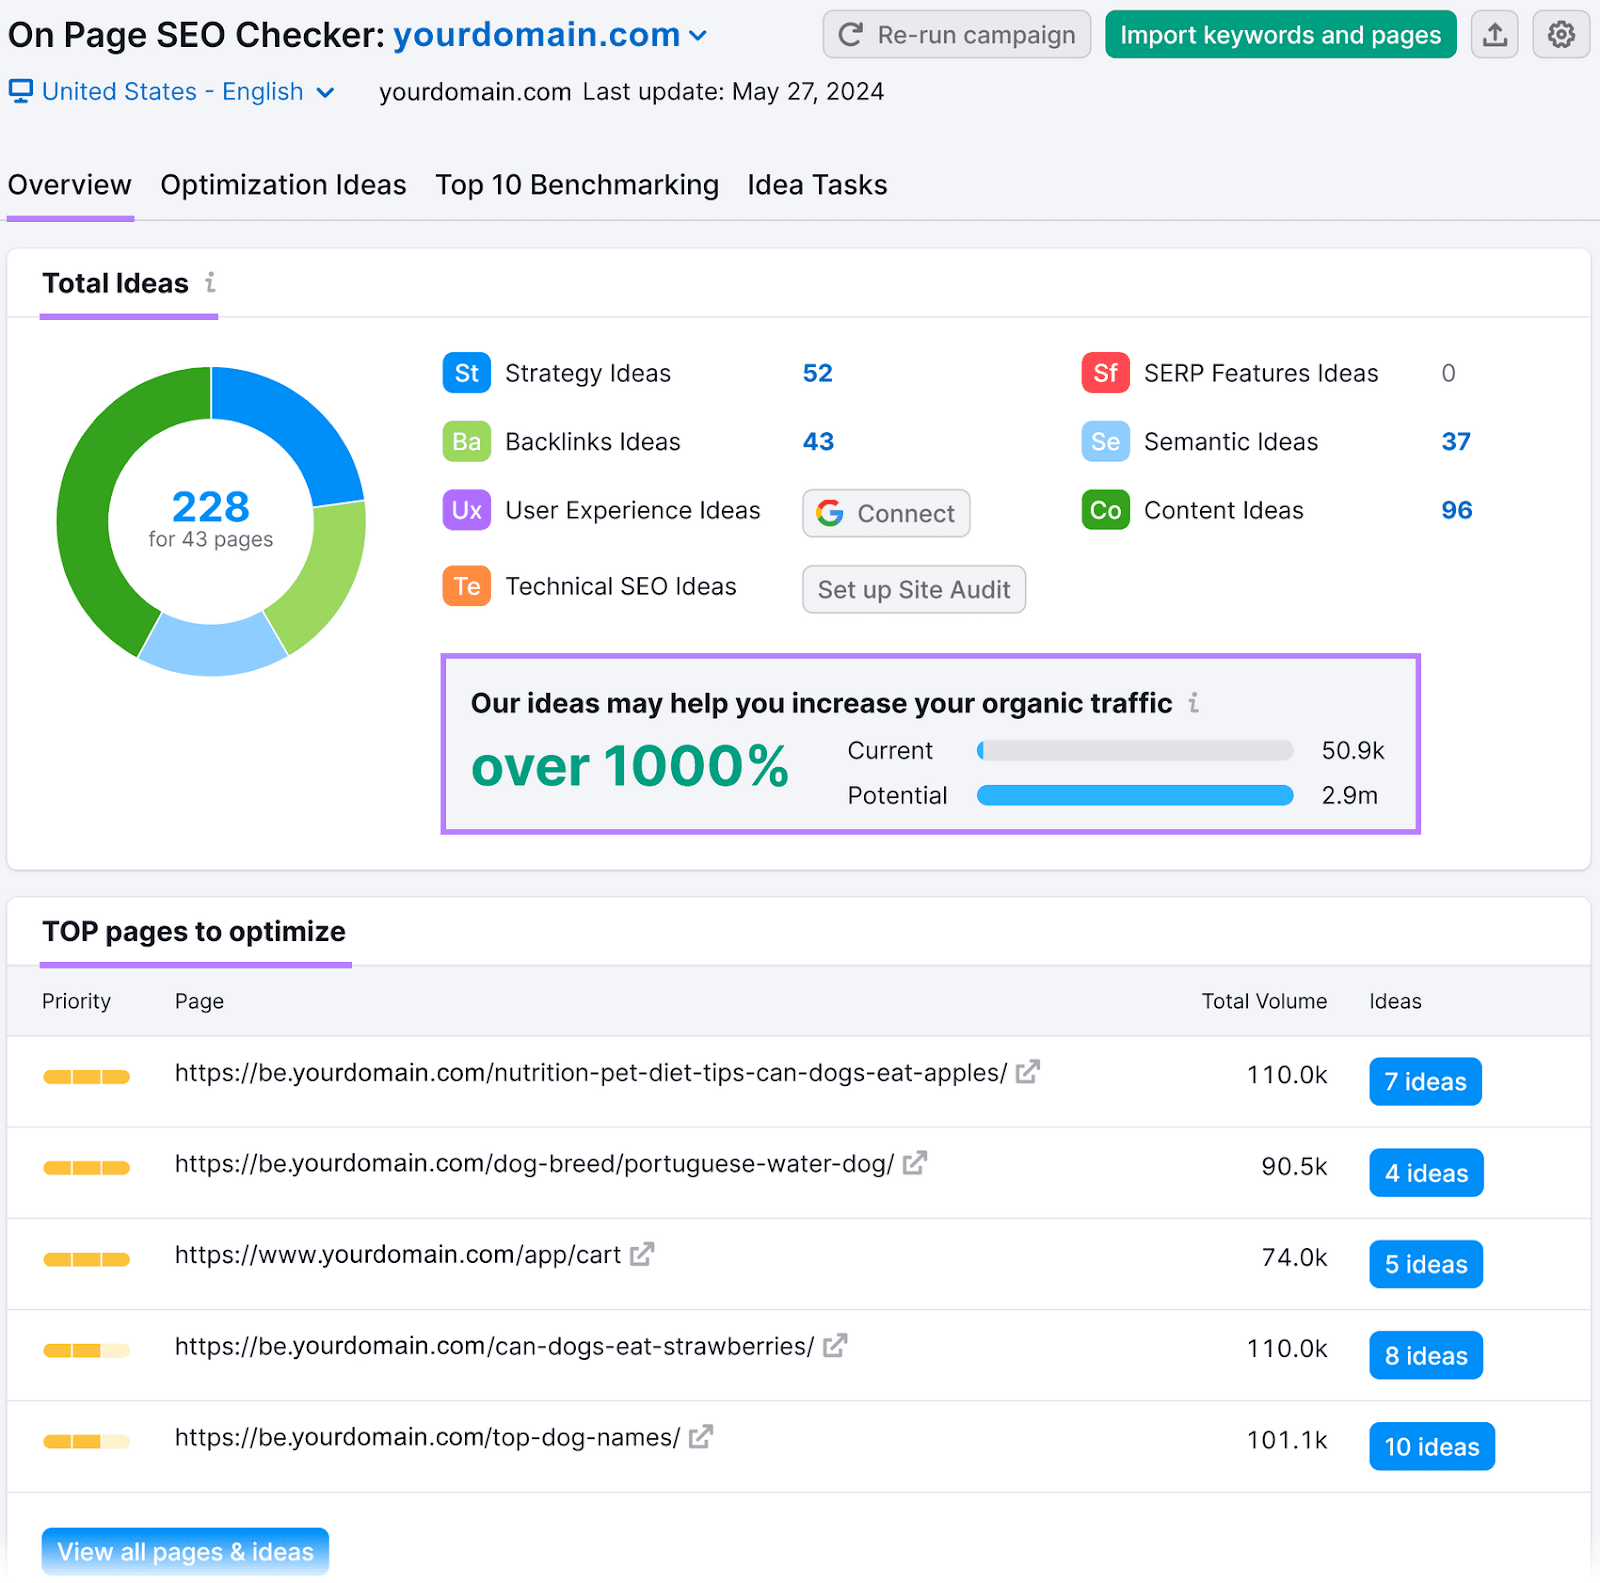
The default “Overview” tab displays your total number of suggested on-page SEO ideas. It also shows you the potential traffic these ideas can help you gain and recommends which pages to start with.
Switch to the “Optimization Ideas” tab to see a list of pages to prioritize.
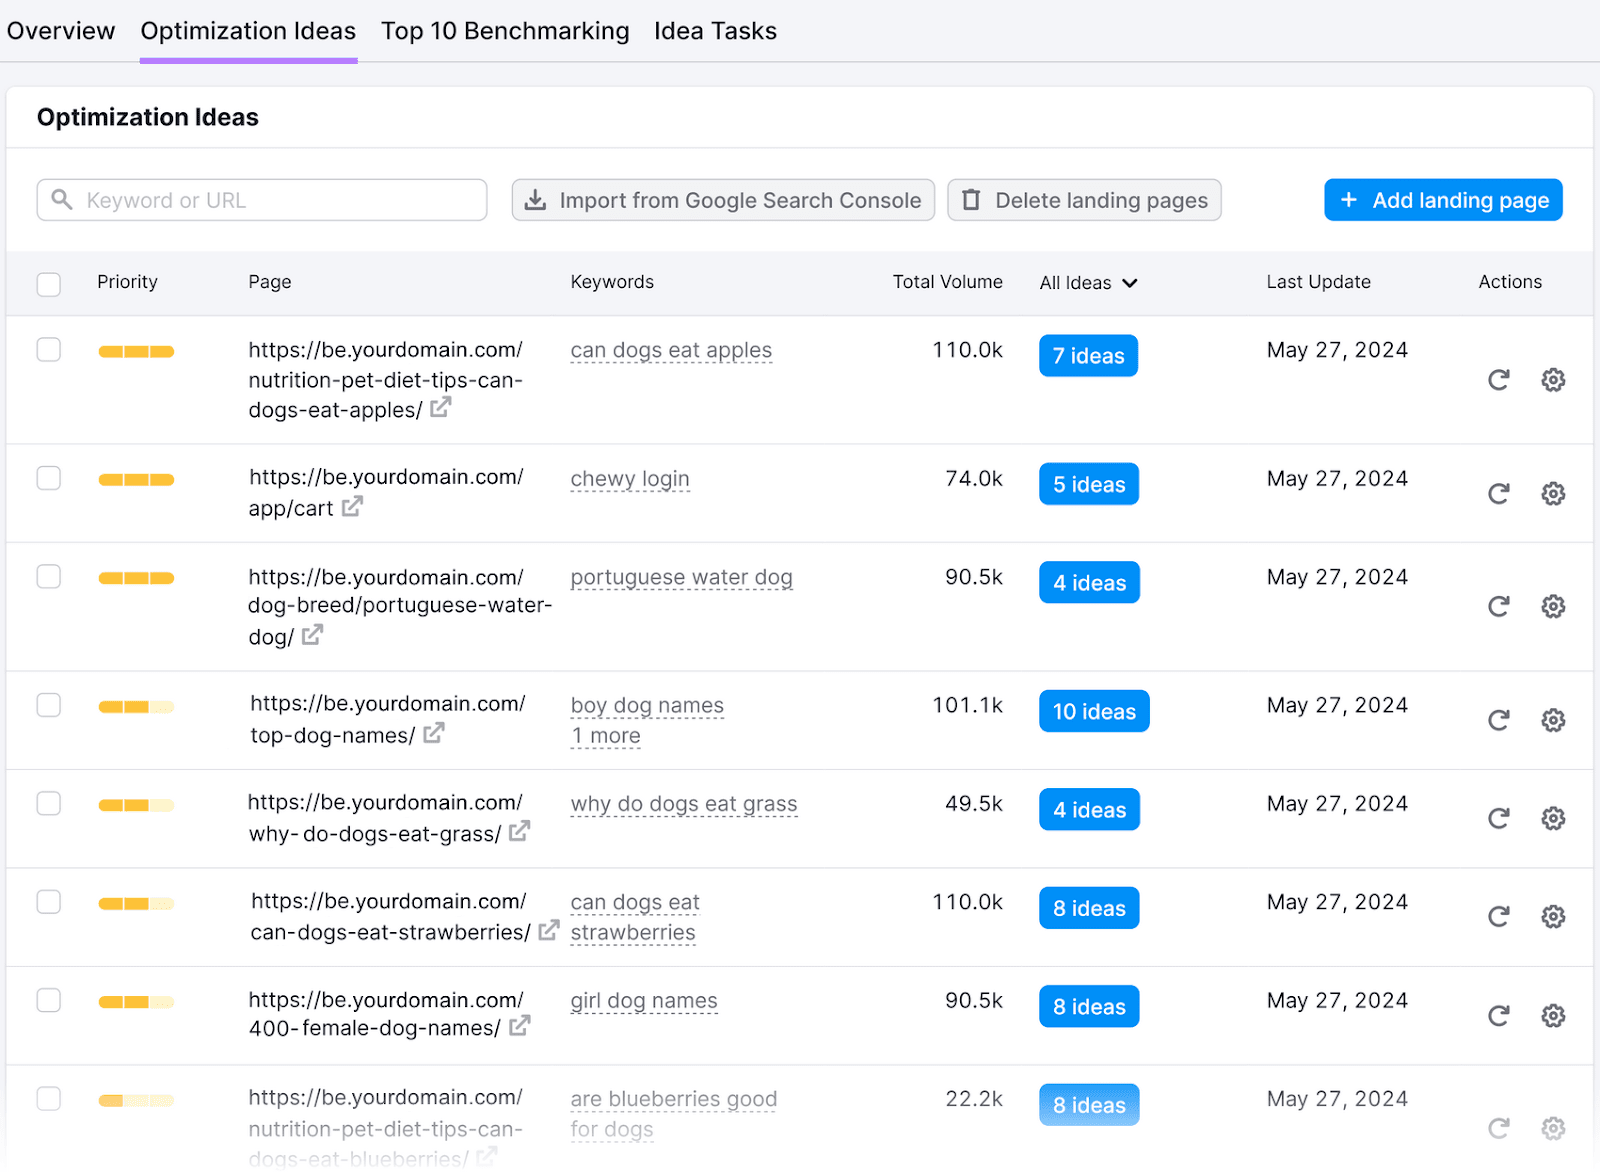
Click “# ideas” next to any page to see specific recommendations to implement.
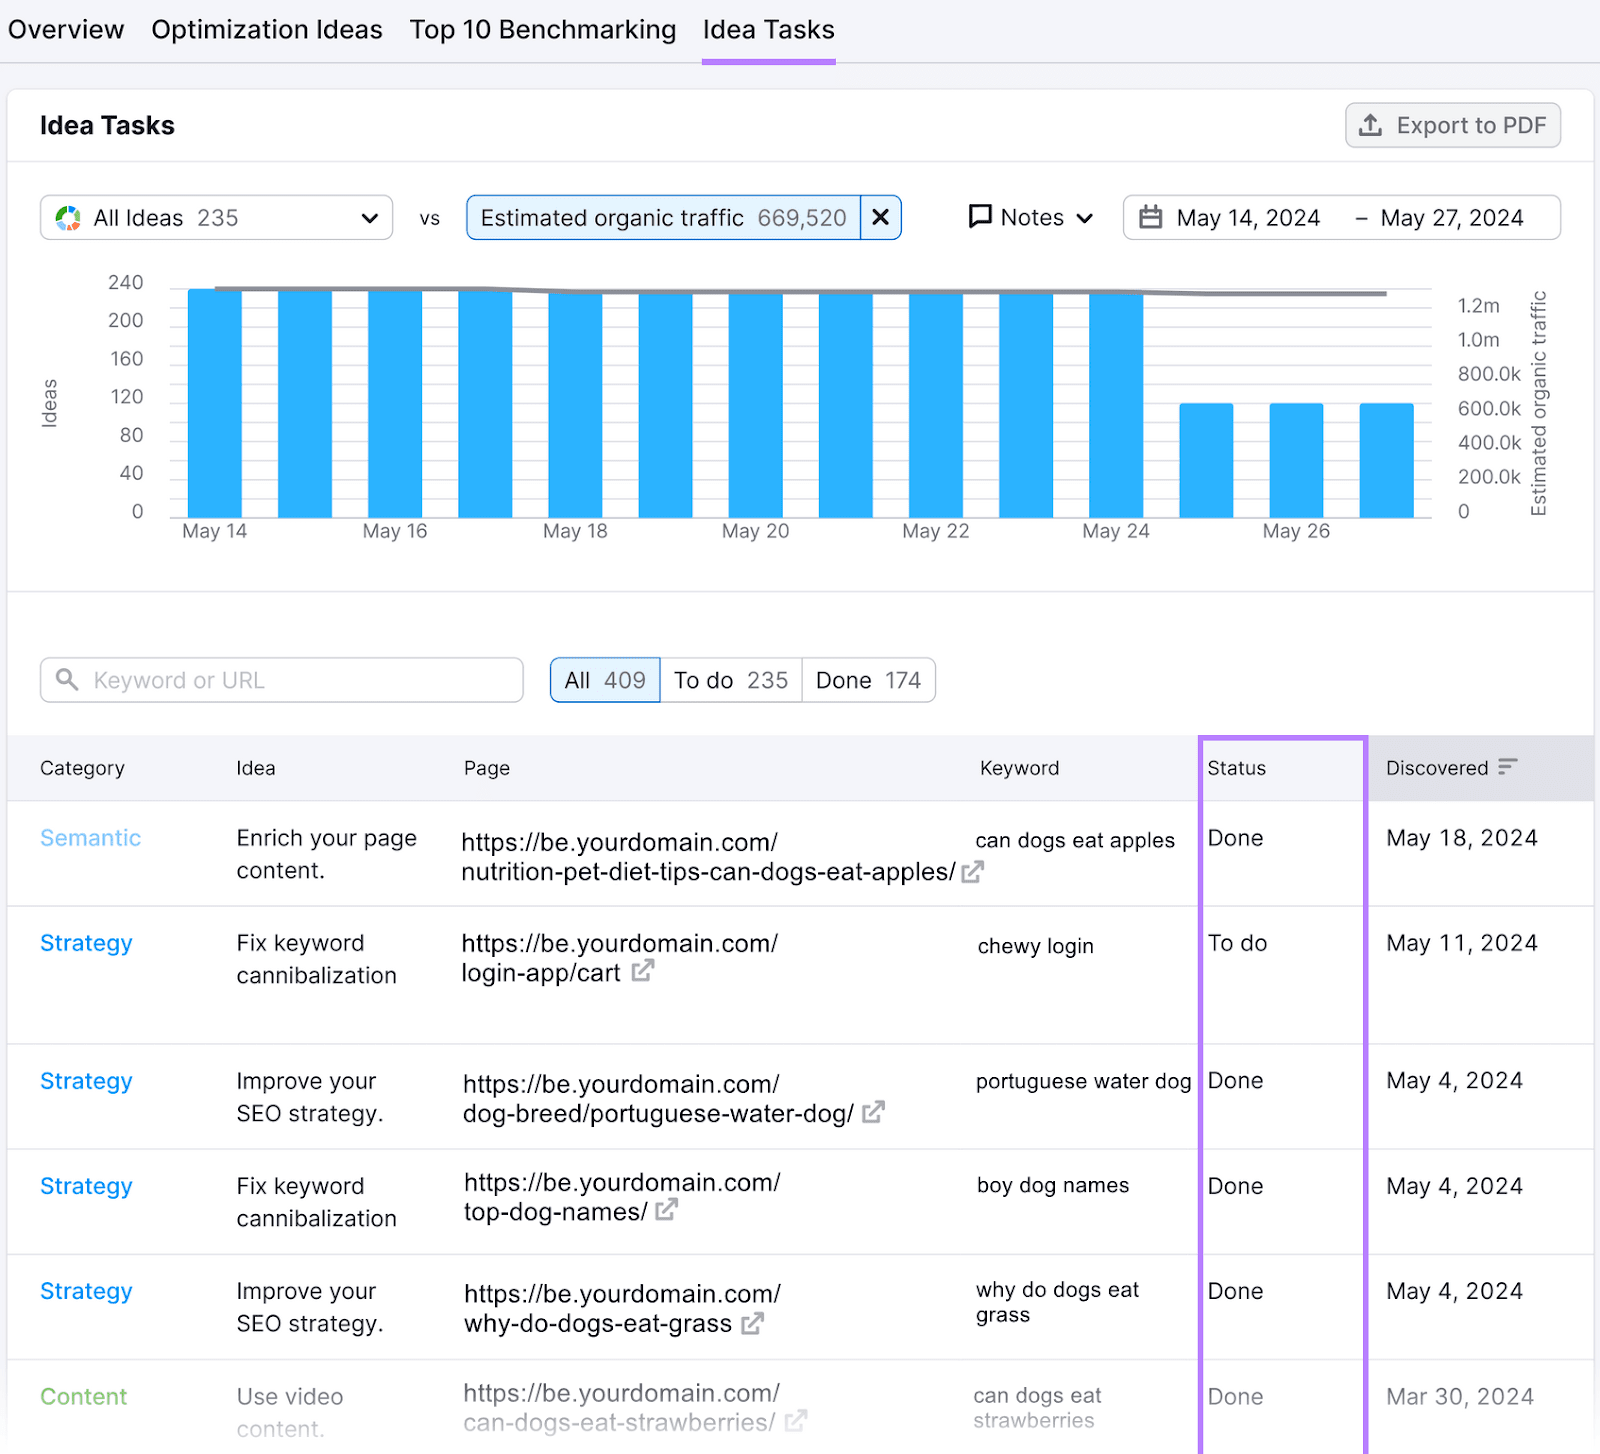
As you work through applying the recommendations, periodically visit the “Idea Tasks” tab to view your progress.
The “Status” tab will indicate which improvements you’ve already made and which still need to be addressed.
After you’ve optimized your existing pages, move on to creating new content centered around keywords you identified earlier that your website doesn’t yet cover.
And keep in mind the recommendations you saw in On Page SEO Checker. To increase the odds of your new content performing well.
Start Monitoring Your Content Today
Regularly monitoring your content performance can help ensure your content marketing strategy is working. And help you make adjustments where needed.
But progress doesn’t happen in a vacuum. So, compare your metrics against your competitors’ metrics to view your performance more holistically.
Get started with Organic Research to find your organic competitors.